The Solo WooCommerce CRO Playbook (Free Template)
The complete weekly CRO operating system for solo WooCommerce stores under $50K/mo. Twelve posts of evidence-backed analysis distilled into a 7-step loop you can run in 10 minutes. Privacy-first, no GA4, no consultants, no $99/mo dashboards — just the ritual that compounds.
Three weeks ago, this blog had zero posts on WooCommerce CRO.
Today, you have a complete operating system. Twelve posts. Forty hours of underlying research. The 7-step weekly loop a solo WooCommerce store can run in 10 minutes. The five evidence-backed mobile bottlenecks. The four exit-page anti-patterns nobody else debunks. The Klaviyo-vs-Woo $86K/$24K revenue reconciliation. The channel-health rule with three caveats that the SERP gets wrong.
If you’ve been reading along since Post 1, you’ve already absorbed most of this. If you’re landing here first, this is the post that ties everything together — the printable, shareable, hand-to-your-VA distillation of the whole sprint.
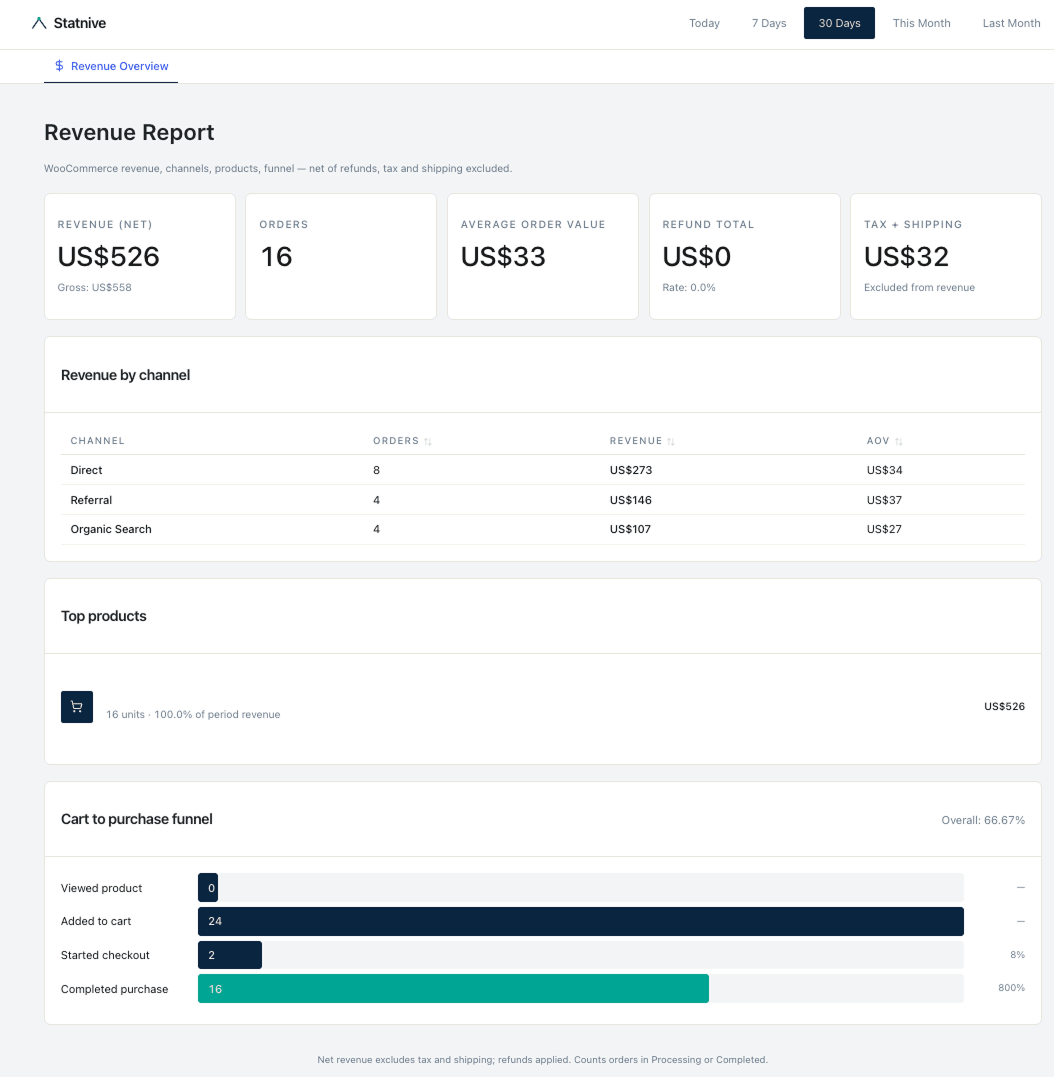
As of v1.0.0 (May 2026), the WooCommerce Revenue Report ships free on WordPress.org — Orders, Revenue (net), Average Order Value, Refund total + Rate, Revenue by Channel across 8 channels (including a dedicated AI Assistants channel covering 14 hosts), Top Products, and a 4-stage Cart-to-Purchase Funnel. Historical orders backfill automatically on first open of the report. The 7-step loop below is updated to use the Revenue Report wherever a cross-reference used to live; the Growth/paid tier waitlist below is for the operational layers (anomaly alerts, Slack/Telegram revenue alerts, ad-spend MER, AI executive summary) that ride on top.
What this playbook gives you
- The complete 7-step weekly CRO loop, with every step mapped to the deeper pillar post.
- A printable one-page cheat sheet of every decision rule from the sprint.
- The honest list of what the v1.0.0 Revenue Report covers and what’s still on the Growth-tier roadmap.
- The reject list — 9 things you should NOT do, with the research debunking each.
- The Growth-tier waitlist for the operational layers (anomaly alerts, Slack/Telegram revenue alerts, ad-spend MER, AI executive summary).
The 7-step weekly CRO loop, fully expanded
Open /wp-admin → Statnive every Monday morning. Run these in order. The version below adds the deeper “why” for each step; the 10-minute version is the printable short form.
Step 1 — Read the room (Overview)
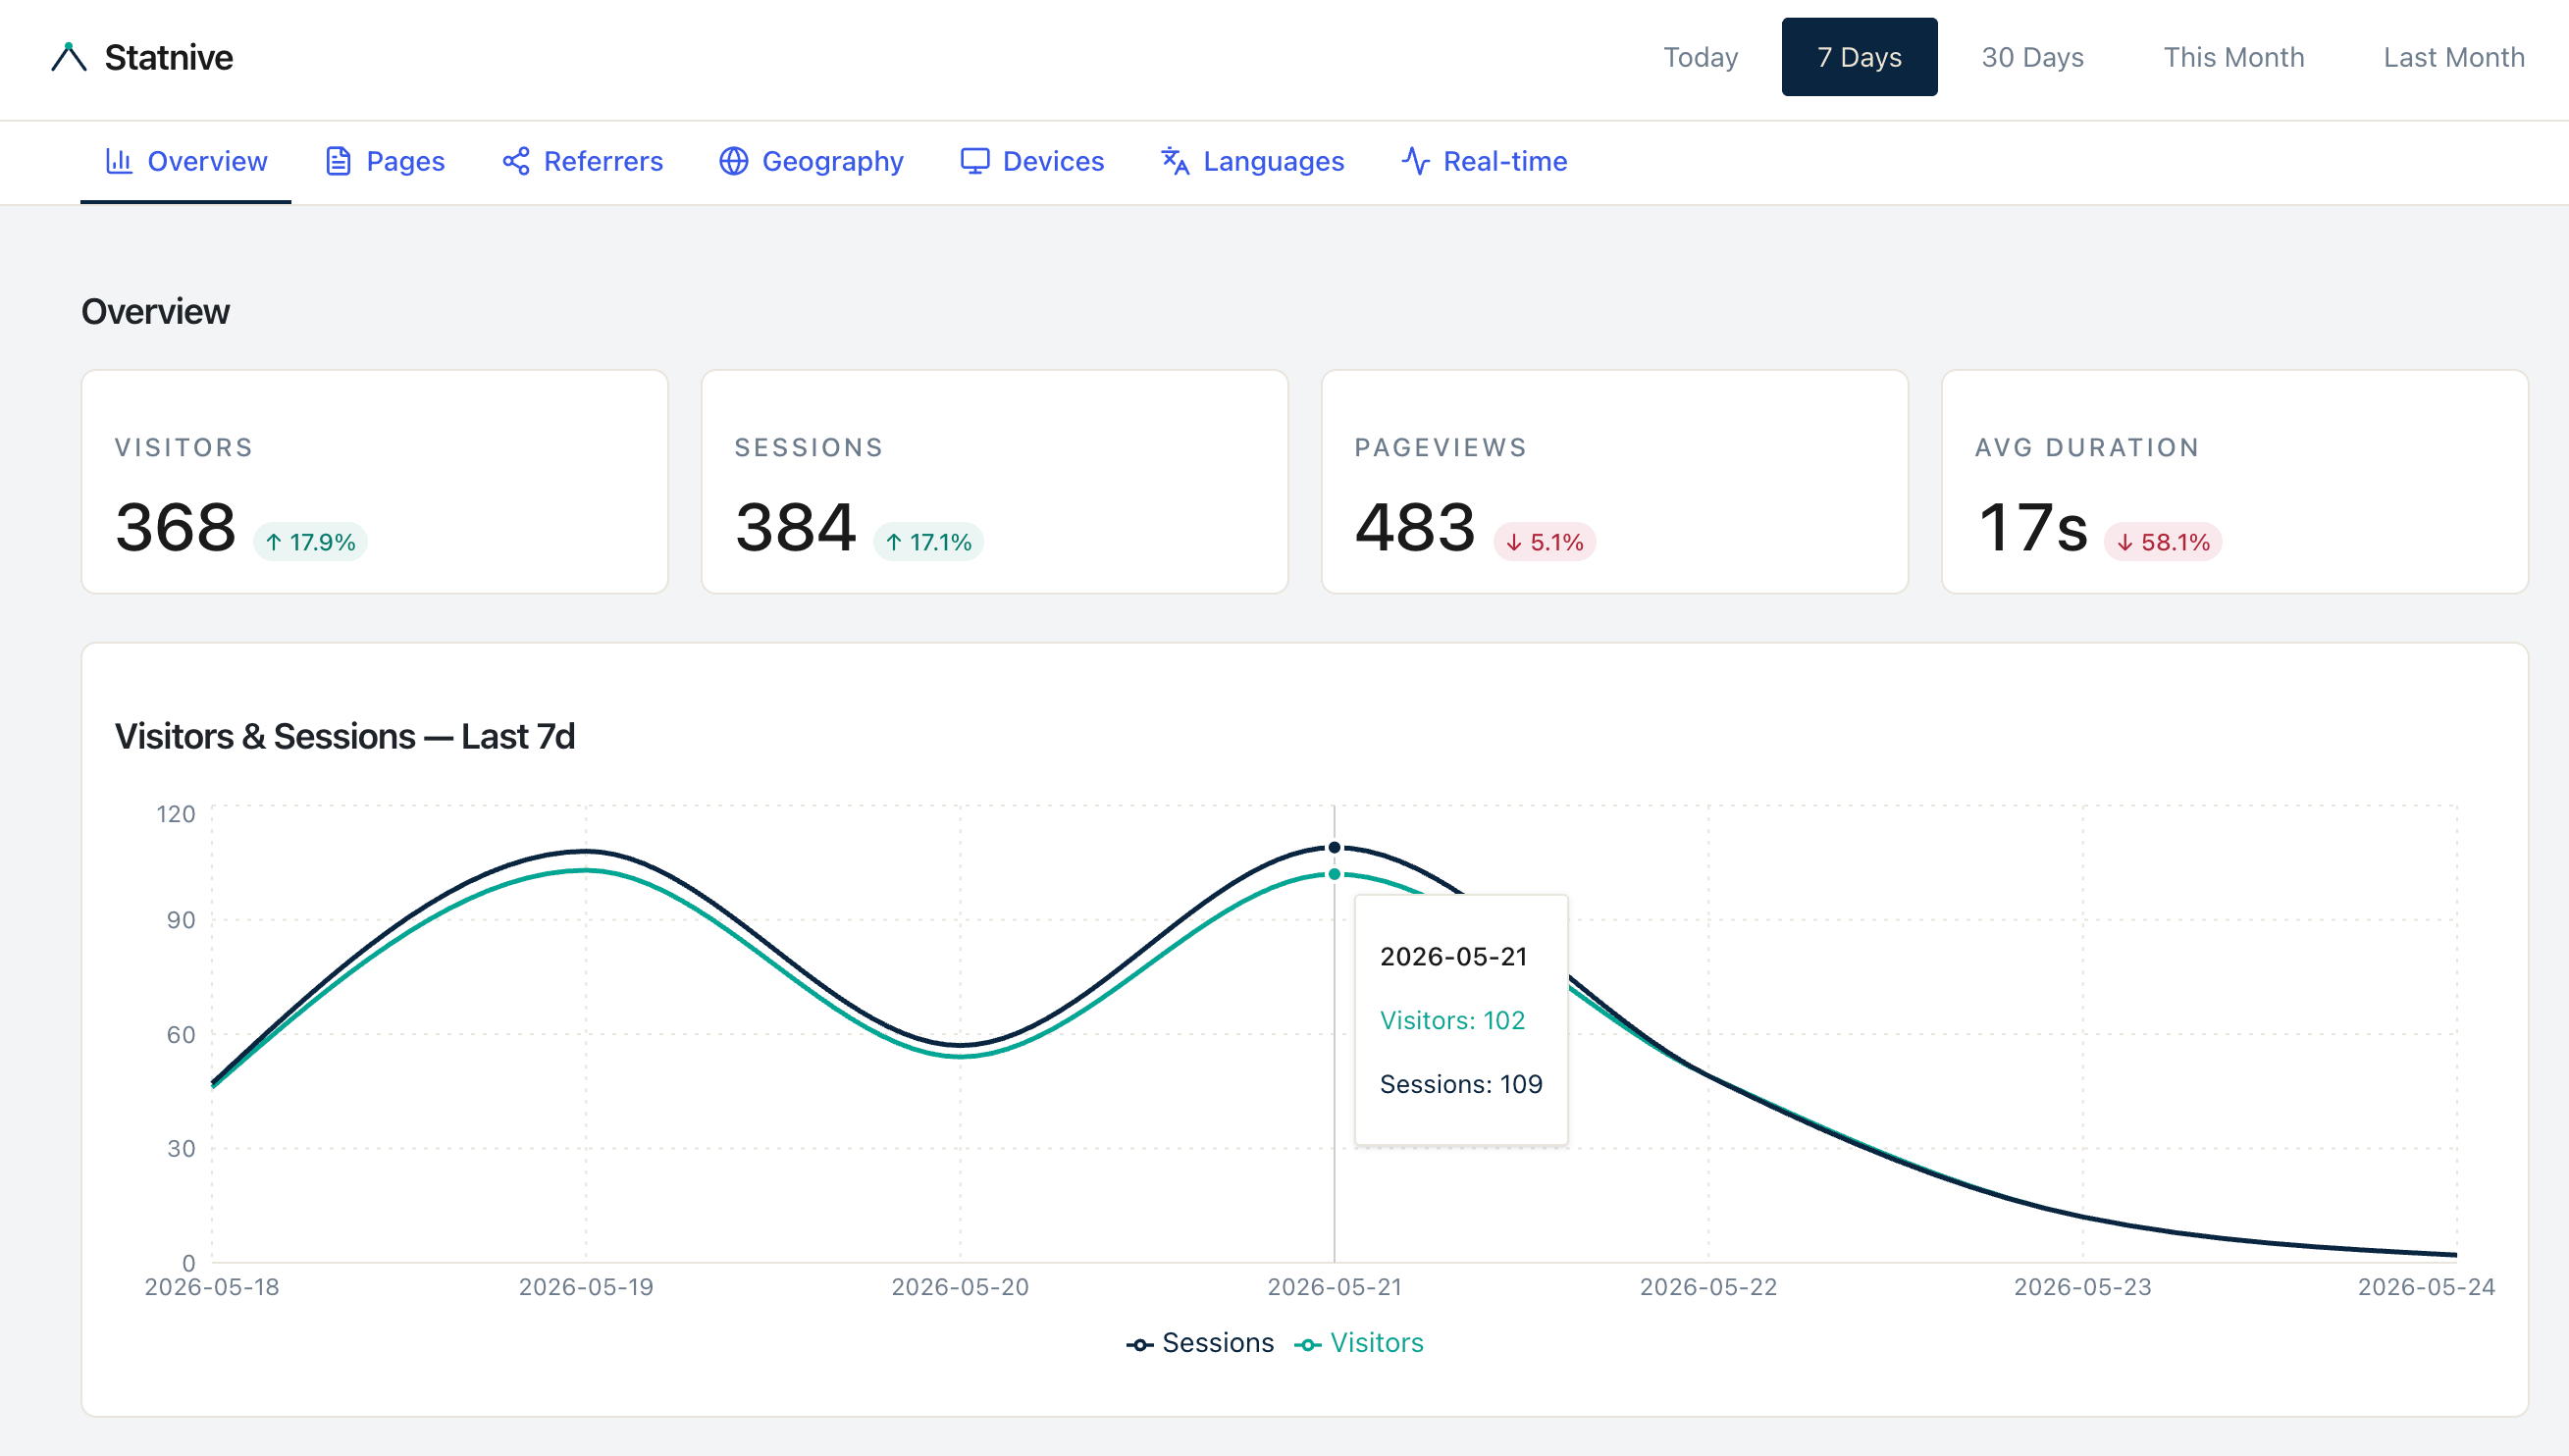
Where: Statnive → Overview report. Last 7 days vs. previous 7 days.
Decision rule: any channel share shift >25% week-over-week = flag for Step 2. Most weeks nothing changes; that itself is signal.
Why this matters: the moment a channel quietly breaks (Google de-indexed a page, a paid ad got rejected, an email landed in spam), the first signal is in the Overview week-over-week delta — often a full week before downstream revenue impact shows up in WooCommerce admin. Catching it in the Overview saves a week of bleeding.
Deeper read: Privacy-First Analytics for WooCommerce CRO (Pillar Post 1).
Step 2 — Audit channel quality (Referrers)
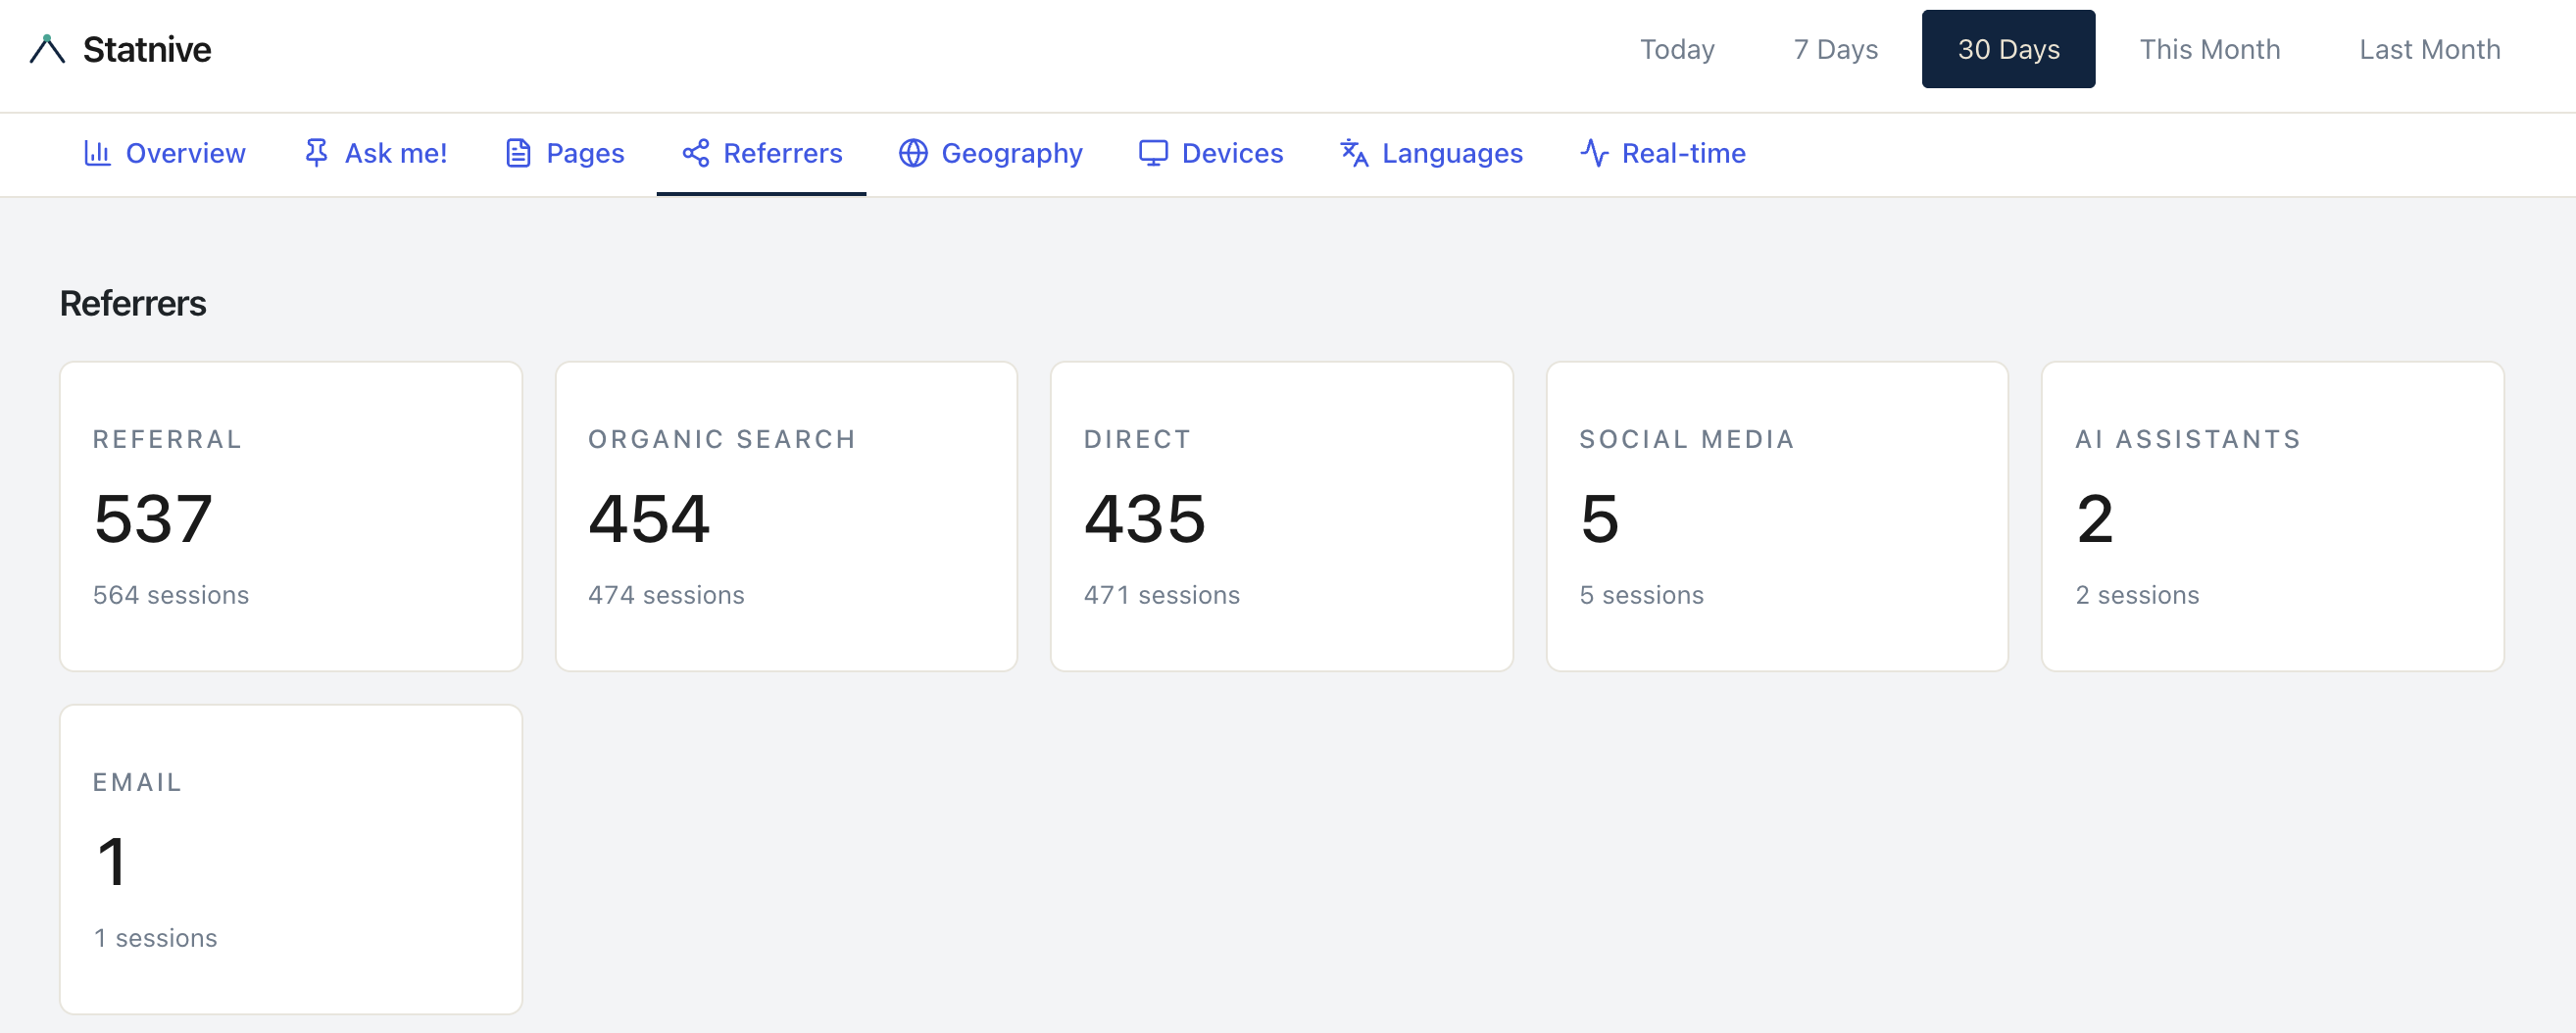
Where: Statnive → Referrers report. Sort by Sessions descending.

Decision rule (channel-health rule): a channel is healthy if bounces ≤ site average AND duration ≥ site average, with ≥50 sessions in a 7-day window. Channels failing both halves get diagnosed — not paused.
Three caveats nobody mentions: (1) compare against intent-matched cohorts, not site-wide; (2) require ≥50 sessions before drawing a conclusion; (3) frame failures as “first to diagnose” not “first to pause.”
Why this matters: Statnive ships 8 auto-grouped channels (Direct, AI Assistants, Organic Search, Social, Email, Referral, Paid Search, Paid Social) — including AI Assistants which GA4 still routes to Direct or Organic. For solo Woo stores at sub-$50K/mo, channel-grouped attribution is more reliable than multi-touch modeling.
Deeper read: Find Best WooCommerce Traffic Sources Without GA4 (Supporting Post 2).
Step 3 — Find your priority leak (Pages — Exit Count)
Where: Statnive → Pages report. Sort by Exit Count descending (not exit rate).
Decision rule: the top page by Exit Count is your priority — even if other pages have “worse” exit rates. A page with 10,000 views and 45% exit rate loses 4,500 sessions; a 500-view page at 90% loses 450. Fix the first.
Why this matters: every other CRO blog sorts by rate. That’s the trap. Sorting by count = your priority queue weighted by traffic. The math is unforgiving — and Statnive’s Pages report shows Exit Count as a column, so the ranking is automatic.
Funnel-position tiebreaker (per CXL PIE/ICE): when two pages have similar Exit Counts, weight bottom-of-funnel pages higher. PDP × 1.2, cart × 1.5, checkout × 1.5 against blog exits at 1.0.
Deeper read: Entry and Exit Pages for WooCommerce Sales (Pillar Post 3) + Analyze WooCommerce Product Pages (Supporting Post 4).
Step 4 — Diagnose mobile vs. desktop (Devices)
Where: Statnive → Devices report. Cross-reference with WooCommerce Analytics → Orders.
Decision rule: compute mobile_CR ÷ desktop_CR. Baseline 0.60-0.74. Below 0.50 with mobile share above 60% = material problem.
The 4 mobile-problem detection patterns:
- Traffic that never reaches checkout = top-of-funnel mobile UX issue.
- Traffic that reaches checkout but fails = bottom-of-funnel checkout issue.
- Product-page mobile bounce = PDP-specific UX.
- Wrong audience to begin with = upstream targeting issue, not mobile UX.
Why this matters: mobile is 70-78% of WooCommerce traffic in 2026. A 1-percentage-point lift on mobile is worth twice the same lift on desktop. The 5 evidence-backed bottlenecks in priority: LCP >2.5s, 375px above-fold CTA, image gallery friction, checkout form/password/captcha, payment provider mismatch.
Deeper read: Mobile Conversion Problems in WooCommerce (Pillar Post 5).
Step 5 — Spot UTM hygiene + paid-ad waste (Referrers UTM)
Where: Statnive → Referrers report → UTM dimensions (Source, Medium, Campaign).
Decision rule: if your Direct share is >25%, you almost certainly have UTM tagging gaps. If a paid campaign has high traffic but fails the channel-health rule on bounces + duration, diagnose before you pause.
The 3 most common UTM hygiene failures:
- Mixed casing —
utm_source=Facebookandutm_source=facebookbecome 2 channels in any analytics tool. - Internal-link UTM contamination — putting UTMs on links between your own pages overwrites the original referrer.
- Dark social leakage — Slack, WhatsApp, email-client link clicks land as Direct because messaging apps strip referrers. The fix is consistent UTM tagging on every shareable link you publish.
Deeper read: Stop Wasting Ad Spend With UTM (WooCommerce) (Supporting Post 6).
Step 6 — Geography + Languages for localization (monthly, not weekly)
Where: Statnive → Geography + Languages reports.
Decision rule: any country supplying ≥5% of sessions with duration ≥80% of your domestic visitors warrants a localization test. Currency display first (POWR estimates up to 40% lift), full translation second.
Why monthly, not weekly: localization signal is slow-moving. Running this monthly is enough.
Deeper read: Which Countries Are Worth Localizing For (Supporting Post 7) + Geography Data to Cut Shipping Costs (Supporting Post 10).
Step 7 — Form one experiment hypothesis (every week)
Where: in your head, with the data from Steps 1-6.
Decision rule: pick one change. Frame as: “If I change [X], then [metric] will improve by [Y] because [signal from Steps 1-6].” Ship it. Note the date. Re-evaluate at 30 days, not weekly.
Why one: running one change at a time means you can attribute the result. Three changes at once means you can attribute none of them. Solo stores below 1,000 sessions per page per month should never A/B test (the math doesn’t support significance in reasonable time). Heuristic-first, one-fix-per-week, 30-day measurement window.
The AI assist: the 12-prompt library is built exactly for this step — paste your CSV export from any Statnive report, get a hypothesis list back. Pair with Post 8 on AI prompts methodology for the prompting principles that don’t hallucinate.
The one-page cheat sheet (printable)
THE SOLO WOOCOMMERCE CRO PLAYBOOK
────────────────────────────────────────────────

WEEKLY (every Monday, 10 min):
  1. Overview — channel share shift >25% WoW? → diagnose
  2. Referrers — does top-3 channel fail bounces+duration rule
     with ≥50 sessions? → diagnose, don't pause
  3. Pages — #1 by Exit Count (not rate), excl. thank-you
  4. Devices — mobile_CR ÷ desktop_CR < 0.50?
     → mobile is this week's experiment
  5. Experiment — pick ONE, frame as "If X then Y because Z"
     Ship. Note date. Re-eval at 30 days.

MONTHLY (one Monday per month, +20 min):
  6. UTM hygiene — any inconsistent casing or duplicates?
  7. Geography — countries ≥5% share + ≥80% domestic duration
  8. Languages — browser-lang vs site-lang mismatch
  9. 30-day re-evaluation — what worked, what to keep

QUARTERLY (one Monday per quarter, +60 min):
  10. Mobile LCP audit via PageSpeed Insights (mobile, target ≤2s)
  11. Baymard checkout-checklist walkthrough on your live store
  12. Channel-spend reallocation based on 90-day quality data

THE 10 DECISION RULES:
- Sort exits by COUNT, not rate
- Compare bounces to INTENT cohort, not site avg
- Require ≥50 sessions before drawing conclusions
- "First to diagnose" not "first to pause"
- Mobile CR ÷ desktop CR < 0.50 = material problem
- One change per week, one re-eval at 30 days
- Cost transparency at PDP (not checkout)
- True guest checkout, password optional
- ≤8 visible checkout fields
- Skip heatmaps, session recording, GA4 import,
  cookie-based cross-device tracking
Save as .txt. Print. Tape to monitor. Done.
The 9 things to NEVER do (with sources)
The reject list from the sprint, consolidated:
- Don’t add a heatmap or session-recording tool. Contradicts privacy positioning; 1,000-session/page minimum for meaningful signal (per Hotjar’s own docs); generates noise at solo-store volumes.
- Don’t import GA4 data. Reinstates exactly the cookie-banner + ad-blocker losses you switched away from.
- Don’t track cross-device with cookies. Same reason.
- Don’t sort exits by rate. Sort by absolute count. (See Step 3 above.)
- Don’t make all CTAs red. Per CXL, contrast not color drives CTA performance.
- Don’t add a homepage carousel. 84% of clicks land on slide 1; total CTR ~1% (per NN/g).
- Don’t add a deceptive countdown timer. Growth Suite’s 847-store study found this increases abandonment 23% and reduces repeat purchases 41%.
- Don’t add mobile-only popups on commerce-intent pages. Google’s 2017 intrusive-interstitial penalty + 23-31% mobile abandonment cost (Baymard).
- Don’t run A/B tests on PDPs under 1,000 sessions/PDP/month. Math doesn’t support significance in reasonable time (per CXL). Heuristic-first instead.
What v1.0.0 added — and what’s still on the Growth-tier roadmap
The v1.0.0 release (May 2026) shipped the four event-aware breakdowns this playbook used to cross-reference WooCommerce admin for. All free, on WordPress.org:
- Revenue per channel inside Statnive. Step 2’s channel-health rule pairs with the Revenue Report’s Channel breakdown — Orders, Revenue, AOV per channel in one tab.
- Cart-to-Purchase Funnel. Step 3’s
/checkoutexit count is now backed by the 4-stage funnel (Viewed product → Added to cart → Started checkout → Completed purchase) with per-step conversion rate. Per-sub-step inside/checkout(shipping vs payment vs review) is still inferred. - Product-level demand vs revenue. Post 4’s “Attractive Failures” analysis can pair the Pages report with the Revenue Report’s Top Products directly — no CSV cross-reference for the parent-product view.
- AI prompts that reason about revenue. Post 8’s prompt library already incorporates Revenue Report data (channel revenue, funnel drop-off, RPV).
Still on the Growth-tier roadmap (planned 2026, paid):
- Anomaly alerts on revenue + traffic deltas
- Slack / Telegram revenue alerts
- Ad-spend CSV import + MER (Marketing Efficiency Ratio)
- Weekly AI executive summary (runs the prompt library automatically and emails the consolidated report)
- Meta CAPI server-side
- Mobile-vs-desktop side-by-side comparison overlay
- UTM hygiene linter (auto-flags casing inconsistencies)
- Per-country revenue dimension on the Revenue Report
The Growth-tier waitlist
If you want to be told when those operational layers ship, the waitlist is below. The free plugin stays free, including the v1.0.0 Revenue Report and everything in this playbook. Growth is for stores that want the alerts + automation on top.
The 12 posts in the sprint, mapped to the loop
| Step | Post | Type |
|---|---|---|
| 1, 2, 3 (foundations) | Post 1 — Privacy-First Analytics for WC CRO | Pillar |
| 2 (channel quality) | Post 2 — Find Best WC Traffic Sources Without GA4 | Supporting |
| 3 (priority leak) | Post 3 — Entry & Exit Pages for WC Sales | Pillar |
| 3 (product-page analysis) | Post 4 — Analyze WC Product Pages Without Complex Dashboards | Supporting |
| 4 (mobile diagnostic) | Post 5 — Mobile Conversion Problems in WC | Pillar |
| 5 (UTM + waste) | Post 6 — Stop Wasting Ad Spend With UTM (WC) | Supporting |
| 6 (localization) | Post 7 — Which Countries Are Worth Localizing For | Supporting |
| 7 (AI assist) | Post 8 — AI Prompts for WC Analytics & CRO | Pillar |
| ad hoc (launches) | Post 9 — Real-Time Analytics During a WC Launch | Supporting |
| 6 (shipping) | Post 10 — Geography Data to Cut WC Shipping Costs | Supporting |
| All steps (operational form) | Post 11 — The 10-Minute Weekly WC Analytics Review | Supporting |
| All steps (this post) | The Solo WC CRO Playbook (you are here) | Pillar |
What to do next
- Bookmark this page.
- Print the cheat sheet.
- Open Statnive next Monday morning. Run the 10-minute weekly review (Step 1, 2, 3, optionally 4, then 7).
- Pick one experiment. Ship it. Note the date.
- Come back in 30 days. Re-evaluate. Run the next week’s review.
- Join the Pro waitlist above if you want to know when revenue-per-channel + funnel-step events ship.
You now have the operating system most solo WooCommerce stores never build. The compounding starts the first Monday you actually run it.