Privacy-First Analytics for WooCommerce CRO (No GA4)
How to use a privacy-first WordPress analytics plugin to make real CRO decisions for your WooCommerce store — without GA4, cookies, or a consent banner. What you can do today, what unlocks later, and the three honest limits every CRO post should admit.
If you sell on WooCommerce as a solo owner, you probably know the feeling. You open Google Analytics 4. You see a bar chart and 14 dropdowns. You look at “Conversions” and the number does not match what your Woo dashboard says. You scroll, click “Engagement”, look at four more screens, and close the tab.
The problem is not that you are bad at analytics. The problem is that GA4 was built for ten-person marketing teams who measure attribution paths, not for a solo Woo owner who needs to know what to fix this week.
This pillar is the answer to the second question. It is a CRO playbook for solo WooCommerce stores using a privacy-first analytics plugin — Statnive — that lives inside /wp-admin. No cookies, no consent banner in most of the EU, no GA4 account, no Looker dashboards. As of v1.0.0 (May 2026), the free Statnive plugin ships eight reports — the seven traffic reports plus a dedicated WooCommerce Revenue Report — and we’ll cover what you can decide today with each of them, plus the three honest things every CRO post should admit and most do not.
What this post answers
- The exact weekly CRO loop you can run in 10 minutes using only Statnive’s free reports.
- Which three CRO recommendations are actually evidence-backed for sub-$50K/mo Woo stores — and which three are myths that still appear in every “ecommerce best practices” article.
- The four sources of WooCommerce truth (Woo native reports, WC Order Attribution, GA4, Statnive) and when to trust each one.
- The honest limits: what Statnive’s CRO playbook does and does not cover, and what the v1.0.0 Revenue Report changes.
Why CRO for a solo Woo store is different
Most CRO content on the web is written for someone who is not you. The big-team CRO playbook assumes:
- A dedicated funnel-analytics tool (Mixpanel, Heap, GA4 with custom events) wired up by a data engineer.
- Session-recording and heatmap budgets (Hotjar, Microsoft Clarity, FullStory) that solo owners cannot afford in time, never mind money.
- Traffic volume in the millions, so A/B tests reach significance in days.
- A separate paid-media team that owns Meta CAPI, click-ID stitching, and Looker reports.
You have none of that. You have your store, two or three Klaviyo flows, maybe a paid Google or Meta campaign, and a Woo dashboard. You also have one more thing: a real, growing audience that hits “decline cookies” the second the banner appears. The independently-replicated estimate — originally Andy Crestodina’s Orbit Media analysis, since cited by Plausible and others — puts GA4 data loss from European consent banners at roughly 30–60% depending on country and audience. A separate 13–30% (40–60% for tech-savvy audiences per Kissmetrics’ 2026 ad-blocker survey) is lost to ad-blockers and tracking-protection browsers on top of that.
That is the working environment. The good news: a solo Woo store can do credible CRO with the right loop and a privacy-first dataset. You do not need session replay. You need a weekly checklist and a tool that does not lose half your visitors.
The 7-step weekly Woo CRO loop (10 minutes, no GA4)
This is the loop. You run it once a week on the same day. Every step is one tab in /wp-admin and one decision.
Step 1 — Read the room (Overview)
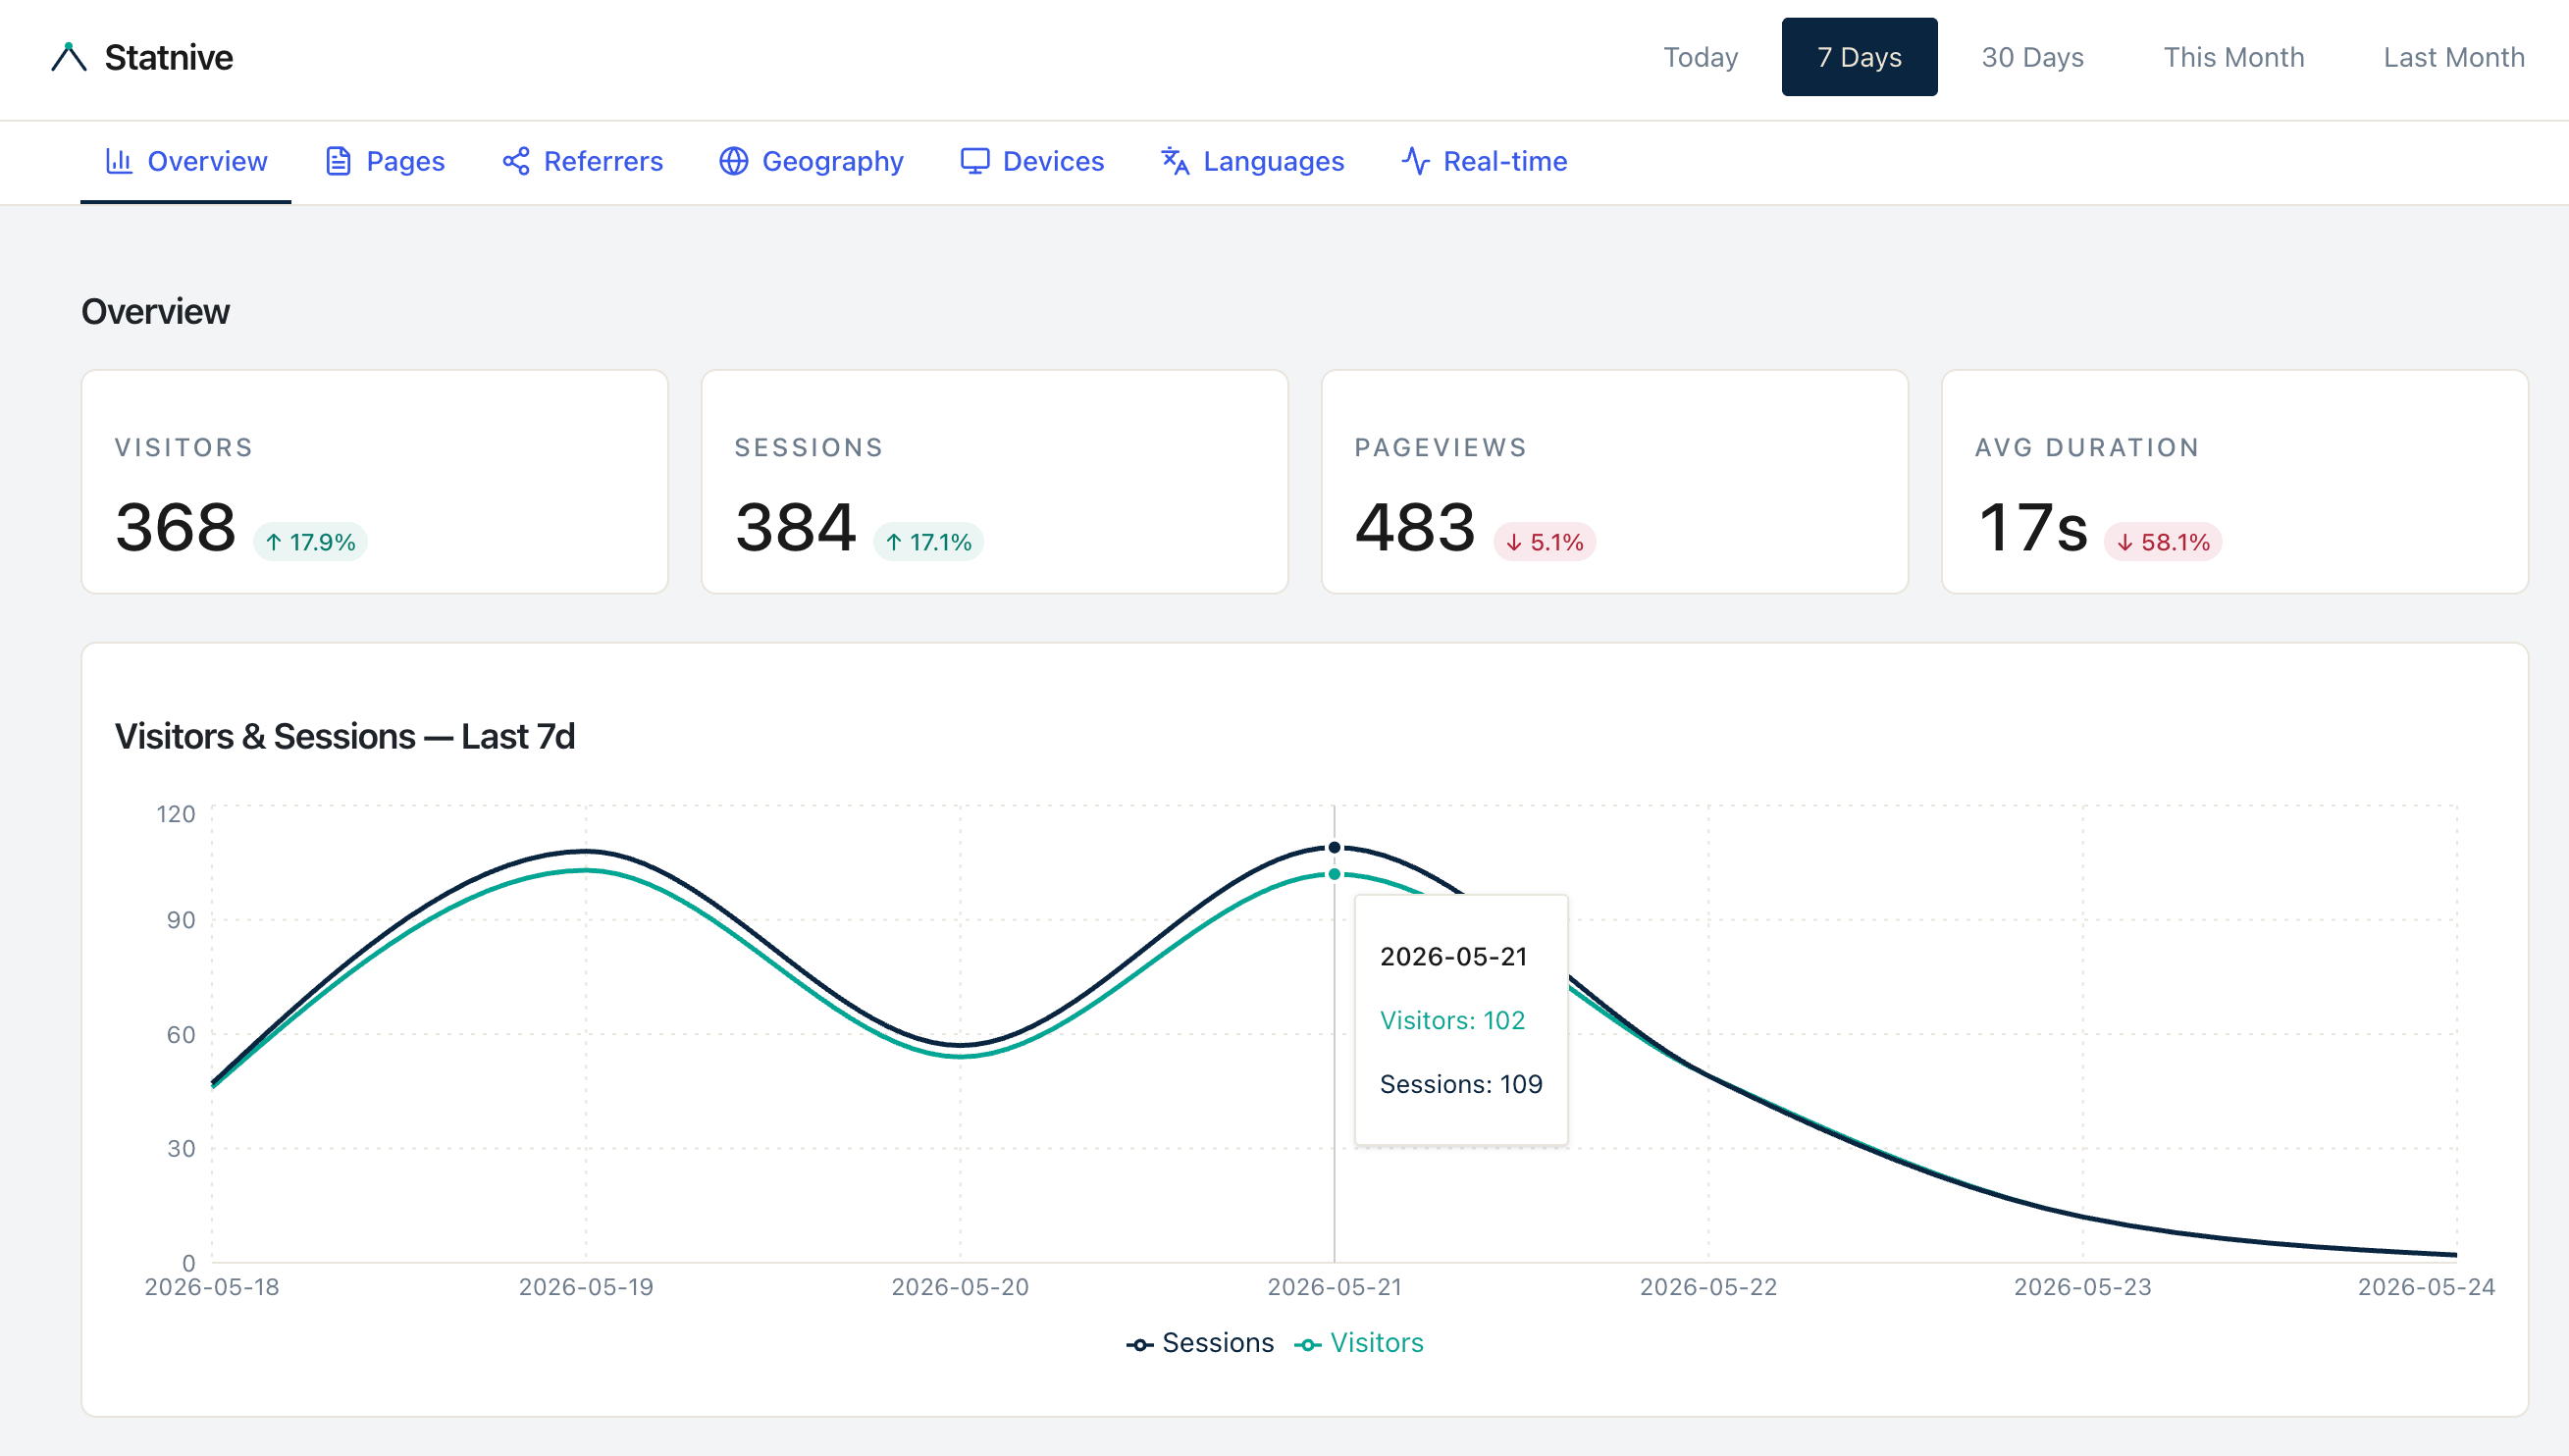
Open the Overview report. Look at sessions, bounces, and total duration for the last 7 days vs. the previous 7. Decision rule: if any single channel’s share changes by more than 25% week-over-week, flag it for Step 2. If your bounces are climbing and duration is dropping on the same channel, you have a quality drop, not a volume drop. Most weeks, nothing has changed. That is also useful information.
Step 2 — Audit the channels (Referrers)
Open the Referrers report. Statnive auto-groups your traffic into eight channels: Direct, AI Assistants, Organic Search, Social Media, Email, Referral, Paid Search, and Paid Social. The AI Assistants bucket is a 2026 addition that catches ChatGPT, Claude, Gemini, Perplexity and 11 more — it would otherwise bucket as “Direct” or “Organic” in GA4.
Decision rule: a channel is healthy if its bounces are at or below the site average AND duration is at or above the site average. Channels that fail both, with at least 50 sessions in the last 7 days, get diagnosed — not paused, not killed, just diagnosed. The post on WooCommerce traffic sources without GA4 walks the full diagnosis.
Step 3 — Find where traffic lands (Pages → entry pages)
Open the Pages report, sort by entry count. Any entry page in your top 10 with a bounce above 70% is your priority — if it is a paid landing page. Blog posts naturally bounce high; the Siege Media benchmark pegs blog-content average around 82%, with ~70% considered “good.” A paid landing page, by contrast, should be well below 50%. Always compare each page to its intent cohort, not the site-wide blend. A 60% bounce on a blog post is fine; a 60% bounce on a paid landing page is on fire.
Step 4 — Find where they leave (Pages → exit pages)
Same report, different sort: by absolute exit count, not exit rate. A page with 10,000 views and a 45% exit rate loses 4,500 sessions. A page with 500 views and a 90% exit rate loses 450. The first page is the priority — even though its rate is “better”.
This is the single decision most CRO posts get wrong. They sort by rate and end up chasing the smallest pages. Sort by absolute loss and you fix what actually matters.
Step 5 — Segment by device (Devices)
Open the Devices report and look at the bounce-rate delta between mobile and desktop on your top entry and exit pages. Per the Deloitte / 55 study Milliseconds Make Millions, a 0.1-second mobile speed improvement produced an 8.4% retail conversion lift and a 9.2% increase in average order value across 30 million sessions on 37 brand sites. If your mobile bounce on a top entry page is more than 15 percentage points higher than desktop, mobile UX is your biggest single CRO lever this week, not the page concept.
Step 6 — Segment by country and language (Geography + Languages)
Cross-reference Geography and Languages. Any country supplying ≥5% of sessions with duration ≥80% of your domestic visitors is a localization test candidate. Per POWR’s International Buyer Benchmark January 2026, 92% of global shoppers prefer to buy from sites that display prices in local currency and 49% would abandon altogether without it. Currency display first, language second.
Step 7 — Form one experiment hypothesis
Pick one thing to change this week. Frame it as: “If I change [X], then [metric] will improve by [Y] because [signal from steps 1–6].” Run it for two weeks or 1,000 sessions, whichever comes first.
That is the loop. Ten minutes. No GA4. No agency report. You will know more about your store after the first run than after a month of opening GA4 and closing it.
What Statnive shows your Woo store today (the inventory)
This is the honest inventory. The free Statnive plugin (v0.4 series) ships seven reports, 13 metrics, and 21 dimensions. They map to the loop above like this:
| You want to know | Report | Metrics |
|---|---|---|
| Is my week different from last? | Overview | Sessions, Bounces, Total Duration |
| Which channels deserve more budget? | Referrers | Sessions, Bounces, Duration, UTM Source/Medium/Campaign |
| Which pages need a rewrite? | Pages | Views, Entry Count, Exit Count, Total Duration |
| Where does my country traffic come from? | Geography | Visitors, Sessions, Total Duration |
| Is mobile bleeding visitors? | Devices | Visitors, Sessions (filtered by Device Type) |
| Are visitors reading me in their language? | Languages | Visitors, Sessions |
| Is the campaign live right now? | Real-time | Active Visitors, Active Page Visitors |
The tracker also captures the WordPress post type on every pageview (a future Resource Type dimension), but that filter is not yet surfaced in the Pages UI. For now, you can separate products from blog posts by URL pattern (/product/ vs everything else) in the Pages report — or pivot directly to Revenue Report → Top Products for the WooCommerce-aware view.
What Statnive does not show your Woo store today
Three things you cannot do without WooCommerce events. Be honest with your readers and yourself about this:
- Revenue per channel. A campaign with high duration and low bounce may still produce zero sales. Without a
purchaseevent tied to UTM, you are inferring. - Funnel drop-off by step. Exit count on
/checkouttells you people leave. It does not tell you whether they entered, applied a coupon, saw a payment error, or chose shipping. - Product-level demand. Page views on a PDP are a proxy for intent, not evidence of intent. Lots of views on a product that never sells is the loudest signal you cannot read without
product_viewandadd_to_cart.
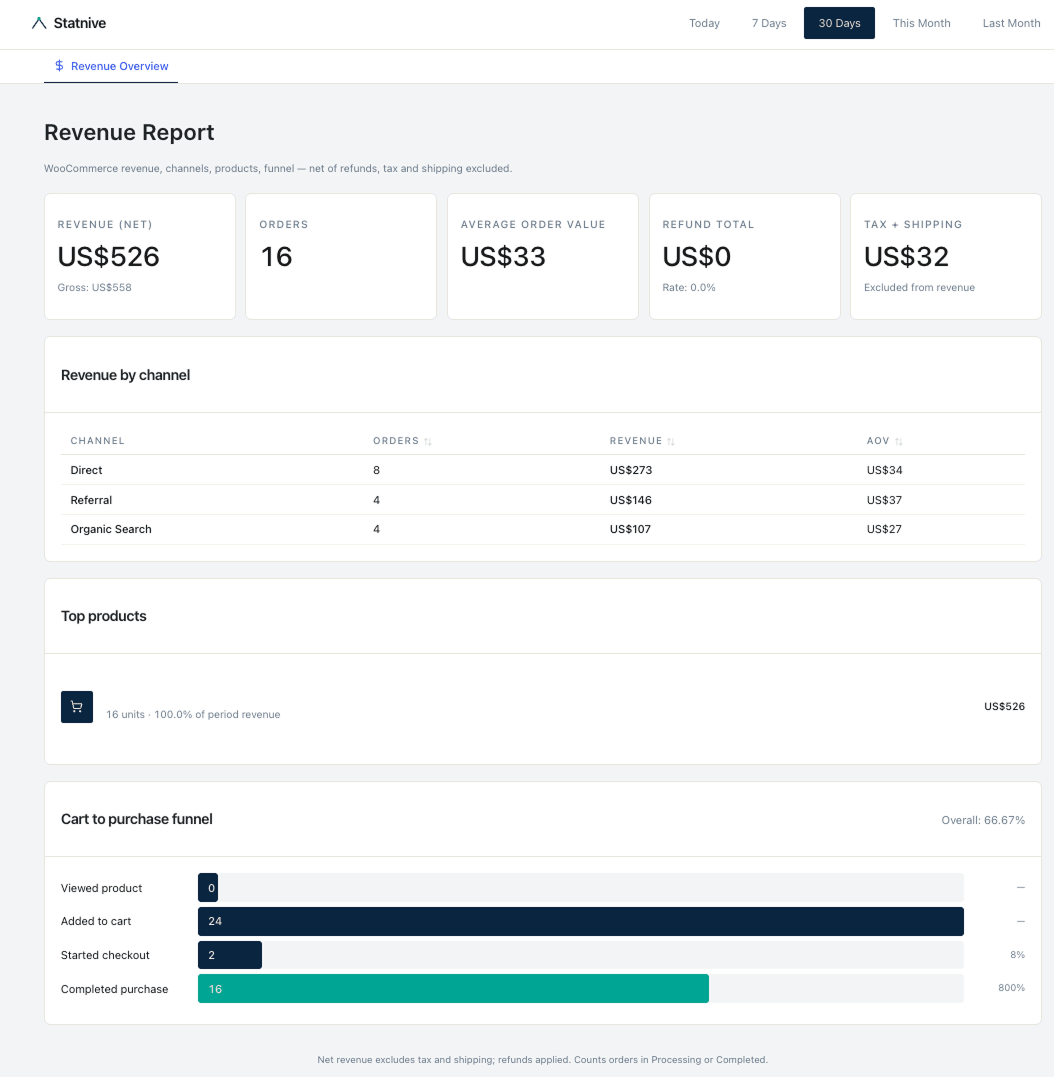
The four ecommerce events — wc_product_view, wc_add_to_cart, wc_checkout_start, and wc_purchase — close every one of those gaps and shipped in v1.0.0 (free, on WordPress.org). The names mirror Google’s recommended GA4 ecommerce event vocabulary on purpose, so any AI prompt or CRO playbook that assumes GA4 conventions keeps working. The events are emitted server-side from WooCommerce — no extra JS to install — and power the Cart-to-Purchase Funnel plus the Channel and Top Products breakdowns on the Revenue Report.
The right framing for every blog post you write about a CRO question is the same: traffic analytics tells you what is getting attention; event analytics tells you what is making money. You can act on the first today and add the second when you are ready.
Four sources of WooCommerce truth, and when to trust each
This is the question nobody answers honestly. You probably have four numbers for “how many sales last week”:
| Source | What it measures | When to trust it |
|---|---|---|
| WooCommerce admin → Reports | The orders in your database | Always — this is the source of revenue truth |
WooCommerce Order Attribution (WC 8.5+, in _wc_order_attribution_* post meta) | First-touch source per order, cookie-based, 7-day window on Safari | When you want order-grain attribution; remember the iOS ITP 7-day cap |
| Klaviyo / Mailchimp reports | Email-attributed revenue with their own 5-day window | When measuring email performance — but expect 2–4× over-reporting against Woo because of Apple Mail Privacy Protection ghost-opens |
| GA4 (if you still run it) | Sampled session-grain with cookie-banner loss | When you need long-tail dimensions Statnive does not yet have |
| Statnive | Cookieless session-grain, no banner loss, no fingerprint, channel-grouped | When you need the whole audience picture — including the 30–55% GA4 misses |
Statnive does not replace WooCommerce’s own revenue report. Statnive replaces GA4 for the questions GA4 is bad at: “where is my whole audience coming from?”, “which channel sends the qualified visitors?”, “is mobile broken on my PDP?”. WooCommerce’s own admin remains the source of revenue truth.
The surprise nobody admits: privacy-first under-count is not a CRO disadvantage
This is the contrarian point of the whole post. Every privacy-first analytics blog admits some version of “yes, we count less than GA4 because we respect Do Not Track”. Then every prospect asks “doesn’t that hurt my CRO?”. The answer is no, and the reason is mathematical, not marketing.
CRO works on relative funnel-step conversion rates, not absolute volume. If 100% of your sources under-count by 25% uniformly, the ranking of which step to fix is identical. The under-count cancels out the moment you divide. The only place uniform under-count hurts is revenue forecasting, and Woo’s own order log is the truth for that anyway.
Where uniform under-count starts to matter is non-uniform under-count — when GA4 misses some channels more than others (e.g., Safari users, iOS app traffic, ad-blocker users). That is the case against GA4 for solo Woo stores, not for it. Statnive’s cookieless first-party tracking is uniform across browsers and devices. Funnel ratios you compute against Statnive data are at least internally consistent; funnel ratios you compute against GA4 are biased toward whatever cohort actually accepts cookies on your site.
That is the answer to the “but we’ll be in the dark!” objection. You will be in less dark than you think, and the dark you are in is uniform — exactly what relative-rate CRO needs.
Three CRO recommendations that actually work (and three that don’t)
From the established CRO research — CXL, Baymard, Nielsen Norman Group — here is what works for sub-$50K/mo Woo stores and what does not.
Works (do this):
- Cost transparency first. Per Baymard Institute’s checkout-usability research, unexpected shipping, tax, and fees cause 39% of non-browsing cart abandonments — the single biggest abandonment reason. Surface delivery cost on the PDP, not at checkout. Fixing this one issue alone can lift conversion meaningfully.
- Optimize per funnel hop, not per purchase. Per CXL’s conversion optimization course, measuring conversion to the next step rather than to final purchase gives faster, clearer signals — exactly the kind of decision Statnive’s exit-count math supports today, even without revenue events.
- Trust channel-grouped attribution at this scale. For stores under ~10K sessions/month, last-touch + clean UTM tagging is more reliable than any multi-touch model. The data engineering overhead of multi-touch is not worth it for solo stores.
Doesn’t work (skip this):
- “Make every CTA red”. CXL’s testing across hundreds of experiments finds that contrast — not color — drives CTA performance. Only about 1 in 7 color tests is statistically significant.
- “Cram everything above the fold”. Per Nielsen Norman Group’s eye-tracking research, only 57% of viewing time is above the fold on modern responsive sites. Placement matters less than copy quality. Scroll is not the enemy.
- “Add a homepage carousel or a countdown timer”. NN/g’s carousel research: 84% of clicks land on slide 1, total click-through is about 1%. Worse, a Growth Suite study of 847 stores found deceptive countdown timers increased abandonment by 23% and reduced repeat purchases by 41%. Carousels are cargo cult; deceptive scarcity actively hurts.
Three WooCommerce gotchas to know before you trust any analytics
If you migrate from GA4 to a privacy-first tracker, you will hit these. They affect every analytics tool, not just Statnive — but if your reports look “off” in the first week, this list usually explains why.
- Block-based checkout does not fire
woocommerce_before_checkout_form. About 13% of stores are on WooCommerce’s new Cart and Checkout Blocks (rising fast). The classic shortcode-based checkout fires the legacy hook, the block-based one does not. Any tracker that listens for that hook is going to under-count begin-checkout on block stores until it is updated to support the new event names. woocommerce_thankyouis unreliable for Stripe, PayPal, and Klarna redirect flows. When the payment gateway returns the shopper in an iframe or via a server-to-server callback, the thank-you page never renders in their browser. Robust purchase tracking pairs the JavaScript thank-you listener with the server-sidewoocommerce_payment_completehook so the event fires even when the browser tab closed. PayPal Payments has had an open issue on this for years.- AJAX add-to-cart in Astra, Botiga, Flatsome, and Kadence suppresses the
/cartpageview. Modern Woo themes increasingly skip the cart page entirely with a slide-in drawer. Any analytics that infers cart-adds from/cartpageviews is going to under-count on those themes. The correct fix is a small JavaScript bridge that listens for theadded_to_cartjQuery event.
As of v1.0.0, Statnive handles all three of these correctly by default. The Revenue Report’s funnel reads wc_product_view, wc_add_to_cart, wc_checkout_start, and wc_purchase server-side from WooCommerce — block-based checkout, redirect-flow gateways, and AJAX add-to-cart themes are all counted. The URL-based separation (/product/ filter) in the Pages report remains useful for content-vs-product cross-references where you want pageviews instead of orders.
Privacy positioning, honestly
One last thing the marketing copy on most privacy-first analytics sites gets wrong: “no consent banner” is a configuration, not a product property. The 27 EU member states do not agree on what counts as audience measurement.
- France (CNIL Sheet 16), Italy (Garante’s Cookie Guidelines 2021), Spain (AEPD), Netherlands (AP under Tw art. 11.7a): a properly configured audience-measurement tool — first-party only, no cross-site identifiers, IP truncation, max 13-month identifier lifetime, max 25-month data retention, no session replay — fits the exemption. No banner required.
- Germany (TDDDG § 25): the DSK Orientierungshilfe Version 1.2 of November 2024 is unambiguous: cookieless tracking also triggers consent when it reads end-device information. That includes reading
navigator.*,screen.*,Intl.*, anddocument.referrer. Statnive’s tracker reads several of these, so the German consent-free configuration is the strictest server-side mode, and even then the safer practice is to ask. - Belgium, Ireland, Austria, UK: similar strict positions; the UK ICO’s Storage and Access Technologies guidance of 29 April 2026 explicitly does not offer an analytics exemption.
The honest claim, on every CRO blog post and pricing page, is: “GDPR-aligned by design — cookieless, no localStorage, no fingerprinting, daily-rotating salts, EU-only hosting. Whether a consent banner is required depends on your jurisdiction and configuration; in most of the EU, the audience-measurement carve-out applies; in Germany, the strictest interpretation still requires user choice.”
That is the honest version. It is also the version that protects you when a customer’s DPO asks.
What to do next, in order
- Install the Statnive plugin from WordPress.org. It is free, and the free tier is the working CRO tier for everything above.
- Run the 7-step weekly loop for two weeks. You will start spotting the “absolute exit-count” priorities by the end of week 1.
- Pick one experiment per week. Frame it as a hypothesis. Run it for two weeks or 1,000 sessions.
- Read the WooCommerce traffic-sources playbook next — it goes deeper on Step 2’s channel-health rule.
- As of v1.0.0 (May 2026), the WooCommerce Revenue Report is in the free plugin — open it for the per-channel revenue, top products, and cart-to-purchase funnel views described above. The loop, reports, and discipline you built in steps 1-4 carry over directly.
The whole point of this approach is that you stop opening GA4, closing it, and feeling guilty about not “doing analytics”. You replace it with a 10-minute Monday loop, decide one thing, and ship the change. That is CRO for a real Woo store. The big-team playbook can wait until you have a big team.