Use Geography Data to Cut WooCommerce Shipping Costs
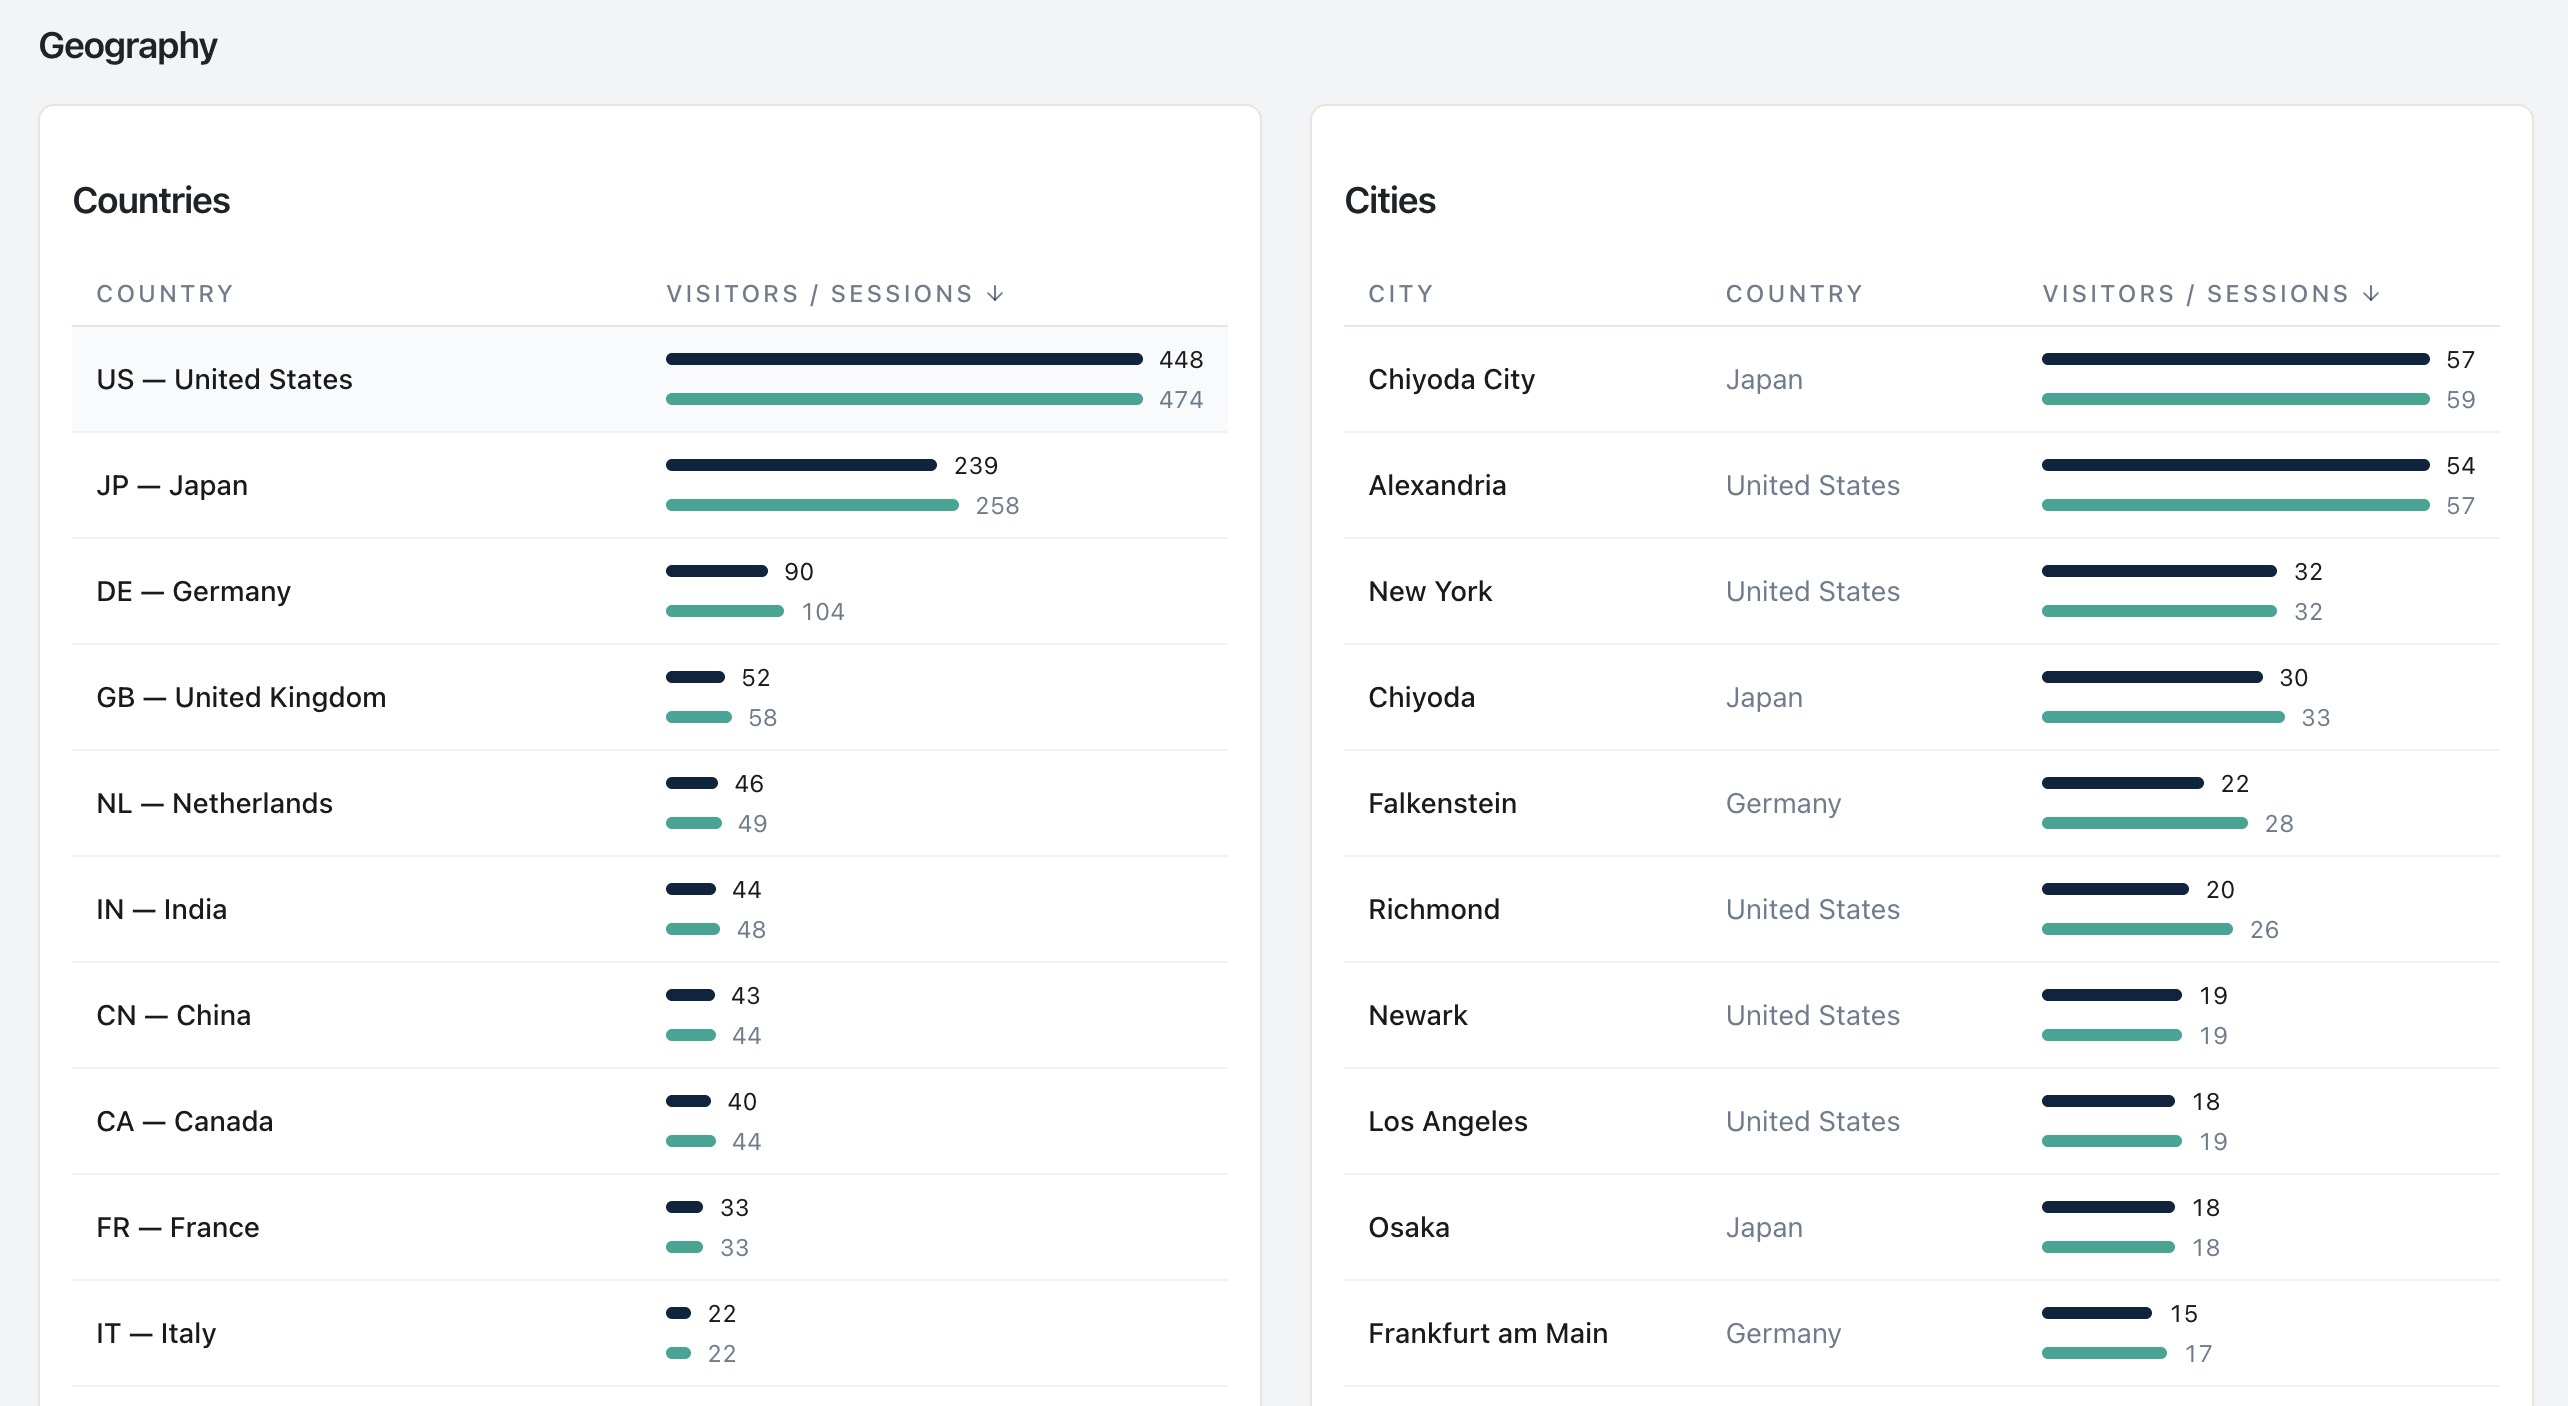
Stop paying for shipping zones you don't need and silently losing sales to countries you forgot to enable. Use Statnive's Geography report + WC Order Attribution to find missed-zone demand, regional-clustering opportunities, and the carrier-rate-vs-revenue mismatches your spreadsheet won't surface.
“I have one EU zone with the same flat rate for all 27 countries. I’m getting murdered on the Nordics and over-charging the Germans.” — r/WooCommerce, paraphrased, 2025
“I have enquiries from would-be buyers in Europe who can’t purchase because their address gets blocked.” — @janecl, WordPress.org, January 2025
The shipping-zone configuration is the silent revenue killer in solo WooCommerce stores. Owners spend weeks optimizing PDPs and checkout flows, then leave a single “flat $25 to anywhere in Europe” rule running for years — losing margin on cheap-to-ship destinations and losing sales on expensive-to-ship ones.
The data to fix this is in your Statnive Geography report today. Cross-reference it with WooCommerce → Orders. Three patterns will surface — and each one is a margin or revenue win.
What this post answers
- The 3 shipping-decision patterns Statnive’s Geography report reveals.
- How to use visitor geography to negotiate better carrier rates (the real lever).
- The DDU vs. DDP customs-duty trade-off (and why surprise duties kill 75% of repeat purchase).
- The hidden costs nobody mentions when they tell you to “ship globally.”
The 3 shipping-decision patterns
Open Statnive → Geography. Filter to the last 90 days. Sort by Visitors. Cross-reference with WooCommerce → Reports → Orders (by destination country) for the same period.
Pattern 1 — High-traffic country with no shipping zone configured
The detection: a country shows ≥3% of total sessions in Statnive Geography but has zero or near-zero orders in WC Orders.
What’s happening: the visitor reaches checkout, the cart shows “no shipping methods available for this address,” and they silently leave. No error event, no support ticket — you don’t see this in any other report.
The fix: add a shipping zone for that country, even if the rate is expensive. A high-rate “we ship to X for $40” beats a “we don’t ship to X” message that the visitor reads as “buy from someone else.” Once the zone is enabled, watch the orders-from-X percentage over 30 days. If demand was real, orders catch up to visitor share.
Real example:
| Country | Statnive visitor share | WC orders share | Pattern |
|---|---|---|---|
| United States (home) | 60% | 65% | Home, normal |
| United Kingdom | 12% | 13% | UK zone configured, conversion at expected rate |
| Canada | 8% | 9% | Canada zone configured |
| Australia | 6% | 0.5% | Silent rejection — no AU shipping zone |
| Germany | 5% | 4% | DE zone configured |
The Australia row is the missed-zone problem. 6% of visitors, near-zero orders. Configure an AU zone; revisit in 30 days.
Pattern 2 — Regional clustering opportunity
The detection: within a continental region (say, EU), one or two countries dominate the traffic. e.g., 60% of EU sessions are from DE/AT/CH (DACH region); the other 24 EU countries split the remainder.
What’s happening: you’re treating “EU” as one zone with one flat rate. The DACH region might be cheap to ship to from your warehouse; the Nordic countries (FI/SE/NO/DK) might be expensive. A flat EU rate undercharges DACH and overcharges Nordics — losing margin on the cheap and sales on the expensive.
The fix: split into 3 tiered EU zones:
- Tier 1 (cheap): DACH or your highest-volume sub-region. Carrier cost is your lowest from your warehouse; pass some savings to customers or capture as margin.
- Tier 2 (medium): Western EU — FR, NL, BE, IT, ES. Mid-range carrier cost.
- Tier 3 (expensive): Eastern EU + Nordics. Highest carrier cost, often longer transit.
This is the configuration that wins on both ends: competitive on cheap zones, defensible on expensive ones.
Pattern 3 — Shipping-zone-vs-revenue mismatch
The detection: a country has comparable visitor share to peer countries but its order conversion is much lower. Not silent rejection (orders aren’t zero), but disproportionate underperformance.
What’s happening: the shipping cost is too high relative to the product price, or the carrier transit is too slow, or both. Visitors browse, see the shipping cost at checkout, abandon.
The fix: investigate which country specifically. Three sub-fixes:
- Cost too high: negotiate a better carrier rate (Pattern below), or move to a partner-carrier model that aggregates volume across stores.
- Transit too slow: add an express option even if it’s more expensive — some visitors will pay more for faster delivery, especially DACH and Nordic markets.
- Customs surprises: switch from DDU to DDP (more below).
Using geography data to negotiate carrier rates
This is the high-leverage move most solo Woo owners never make. Carriers offer volume-discount tiers based on shipment counts per zone. Walking into a UPS / FedEx / DHL / national-post account-manager meeting with “I want a better rate” gets you list-minus-4% if they’re feeling generous. Walking in with a data sheet showing actual volume by zone gets you list-minus-15% to list-minus-25% routinely.
The data sheet you walk in with:
From Statnive Geography + WC Orders, for the last 12 months:
| Zone | Visitor share | Order count | Avg package weight | Avg order value |
|---|---|---|---|---|
| Domestic | 60% | 4,800 | 0.8 kg | $65 |
| UK | 12% | 960 | 0.9 kg | $72 |
| DACH | 8% | 640 | 1.0 kg | $85 |
| FR/BE/NL | 5% | 400 | 0.9 kg | $70 |
| Other EU | 7% | 380 | 1.0 kg | $68 |
| Australia | 6% | 0.5%-of-traffic (silent reject) | n/a | n/a |
| Canada | 2% | 160 | 0.8 kg | $75 |
A regional carrier rep can read this and price accordingly. You’re not asking for a favor; you’re showing volume. The two-page conversation is the difference between paying $14 to ship a package to Germany and paying $9.
The carriers to ask:
- US: UPS, FedEx, USPS, DHL eCommerce
- UK: Royal Mail (esp. Tracked 24 / Tracked 48 services), DPD, Evri
- EU: Deutsche Post (DE), La Poste (FR), PostNL (NL), Posti (FI), GLS, DPD pan-EU
- Australia: Australia Post, Sendle, Aramex
- Canada: Canada Post, FedEx Canada, Canpar
For sub-1,000 orders/month, a 3PL aggregator like ShipStation, ShipBob, or Sendcloud often beats direct-carrier rates by pooling volume across thousands of stores. Check.
DDU vs DDP — the customs duty trade-off
If you ship internationally, every order crosses customs. Two models:
DDU (Delivered Duty Unpaid)
The buyer is charged duties + customs fees on delivery by the carrier. They pay the customs charge separately before the package is released.
- Pro: simplest config for the seller. Cheapest at checkout.
- Con: surprise charge for the buyer. Per industry surveys, 75% of customers say they won’t return after a surprise customs charge, and 10% of DDU parcels are refused at delivery (returned to sender, costing the seller round-trip shipping + the original order).
DDP (Delivered Duty Paid)
You collect duties + customs fees at checkout. The buyer pays one all-in price; you remit to customs.
- Pro: no surprise. Better repeat-purchase rate. Lower refusal rate.
- Con: more complex configuration. Requires duty-calculator plugins (Zonos, Crossborderit, Avalara) or carrier-native solutions. Adds 1-2% to checkout time.
The honest recommendation for solo Woo stores: if international is below 10% of your orders, DDU is fine — you’ll absorb the occasional refused package as a cost of doing business. If international is above 10%, DDP is worth the configuration overhead because the repeat-purchase math is decisive.
The hidden costs of shipping internationally
The “go global!” listicles never mention these. Build them into your decision:
- Customs/duties (above): 75% won’t return after a surprise charge.
- 3-4× support-ticket cost. International orders generate disproportionately more “where is my package?” tickets due to longer transit + customs delays. Each ticket costs 3-4× the time of a domestic equivalent.
- Returns 3-5× domestic cost. Return shipping from EU to US (or vice versa) costs $25-60 per package. If you offer free returns, expect to either eat this cost or build it into product margin.
- Translation regression risk. Every plugin / theme update can break the localized shipping calculator. Budget for a quarterly check.
The closing test: if you can’t afford to write off 1 in 10 international parcels (refusals + returns + customs surprises), you can’t afford international shipping yet. Get the domestic margin solid first, then add zones one at a time.
Known gap — destination country on the Revenue Report
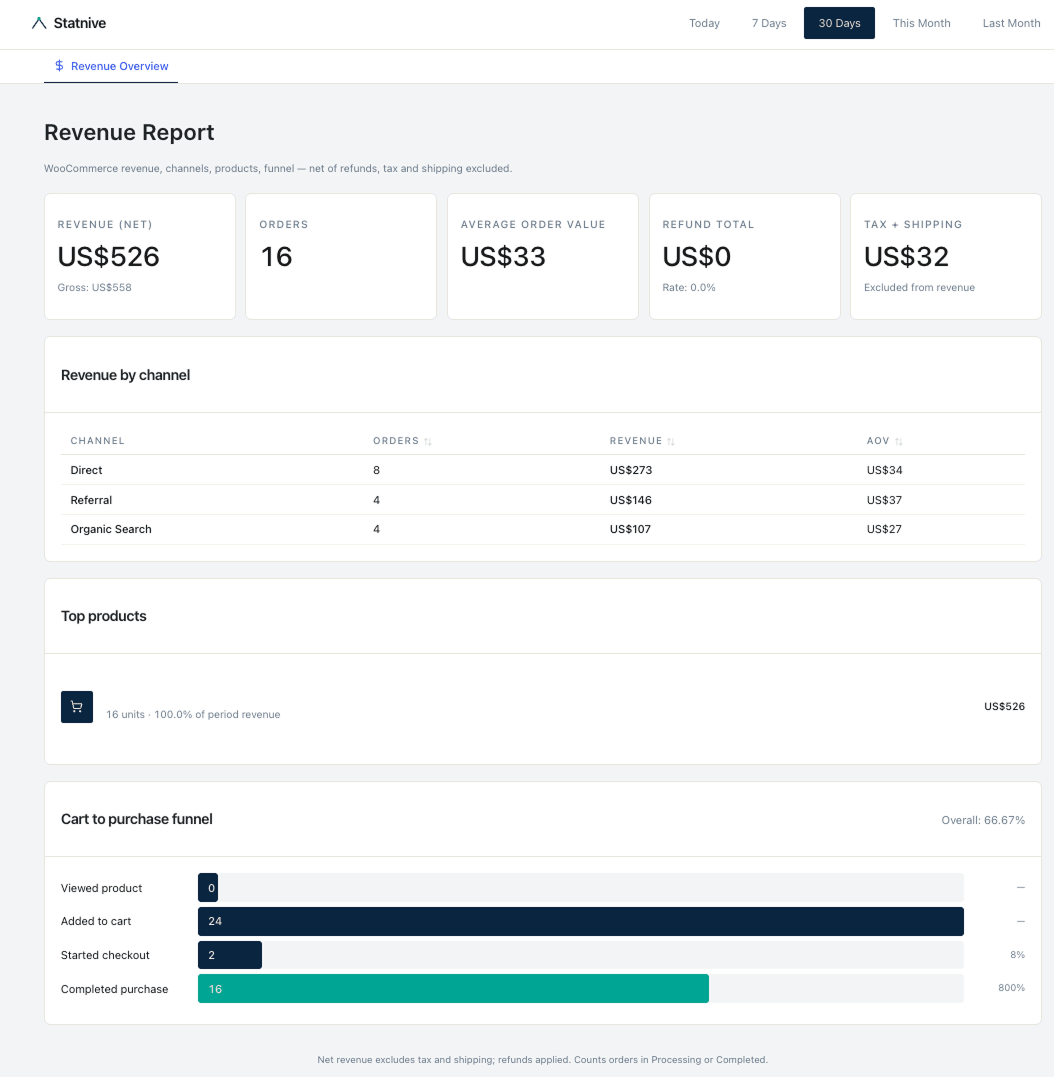
Statnive v1.0.0’s Revenue Report aggregates revenue by Channel, Top Products, and Cart-to-Purchase Funnel. Per-destination-country revenue is not a v1.0.0 dimension. For the silent-rejection cross-reference above, the workflow stays manual two-tab: Statnive Geography (visitor origin) + WooCommerce → Reports → Orders (order destination). The Revenue Report adds the headline KPIs (Orders, Revenue net, AOV) at the global level — useful for confirming whether adding a new shipping zone moved the topline number — but you still drop into WC Orders for the per-country breakdown.
What to do next
- Open Statnive Geography for the last 90 days. List your top 10 countries by Visitor share.
- Cross-reference with WC Orders (last 90 days, sort by destination).
- Identify the 3 patterns: missed zones (silent rejection), regional clustering, cost-vs-conversion mismatches.
- Configure missed zones first. Wait 30 days. Measure order share.
- Build the data sheet for your next carrier-rate negotiation.
- For the broader CRO loop, see the pillar on Privacy-First Analytics for WooCommerce CRO.
Visitor geography is the cheapest, most-underused negotiation lever in solo WooCommerce. Use it.