Real-Time Analytics During a WooCommerce Launch or Email Send
Hit send on your flash-sale email. Open Statnive's Real-time view. What you can prove in the first 15 minutes, what you can't, and the 4-checkpoint rhythm that prevents the 'refresh-every-30-seconds-panic-at-any-dip' anti-pattern that kills good campaigns.
“I felt sick for 45 minutes for no reason. First order arrived at minute 47.” — @mariajulia78, WordPress.org, November 2024 (post-Black-Friday flash sale)
“My wife genuinely told me I look like a stock trader having a heart attack.” — etsybirdseed, IndieHackers, July 2025
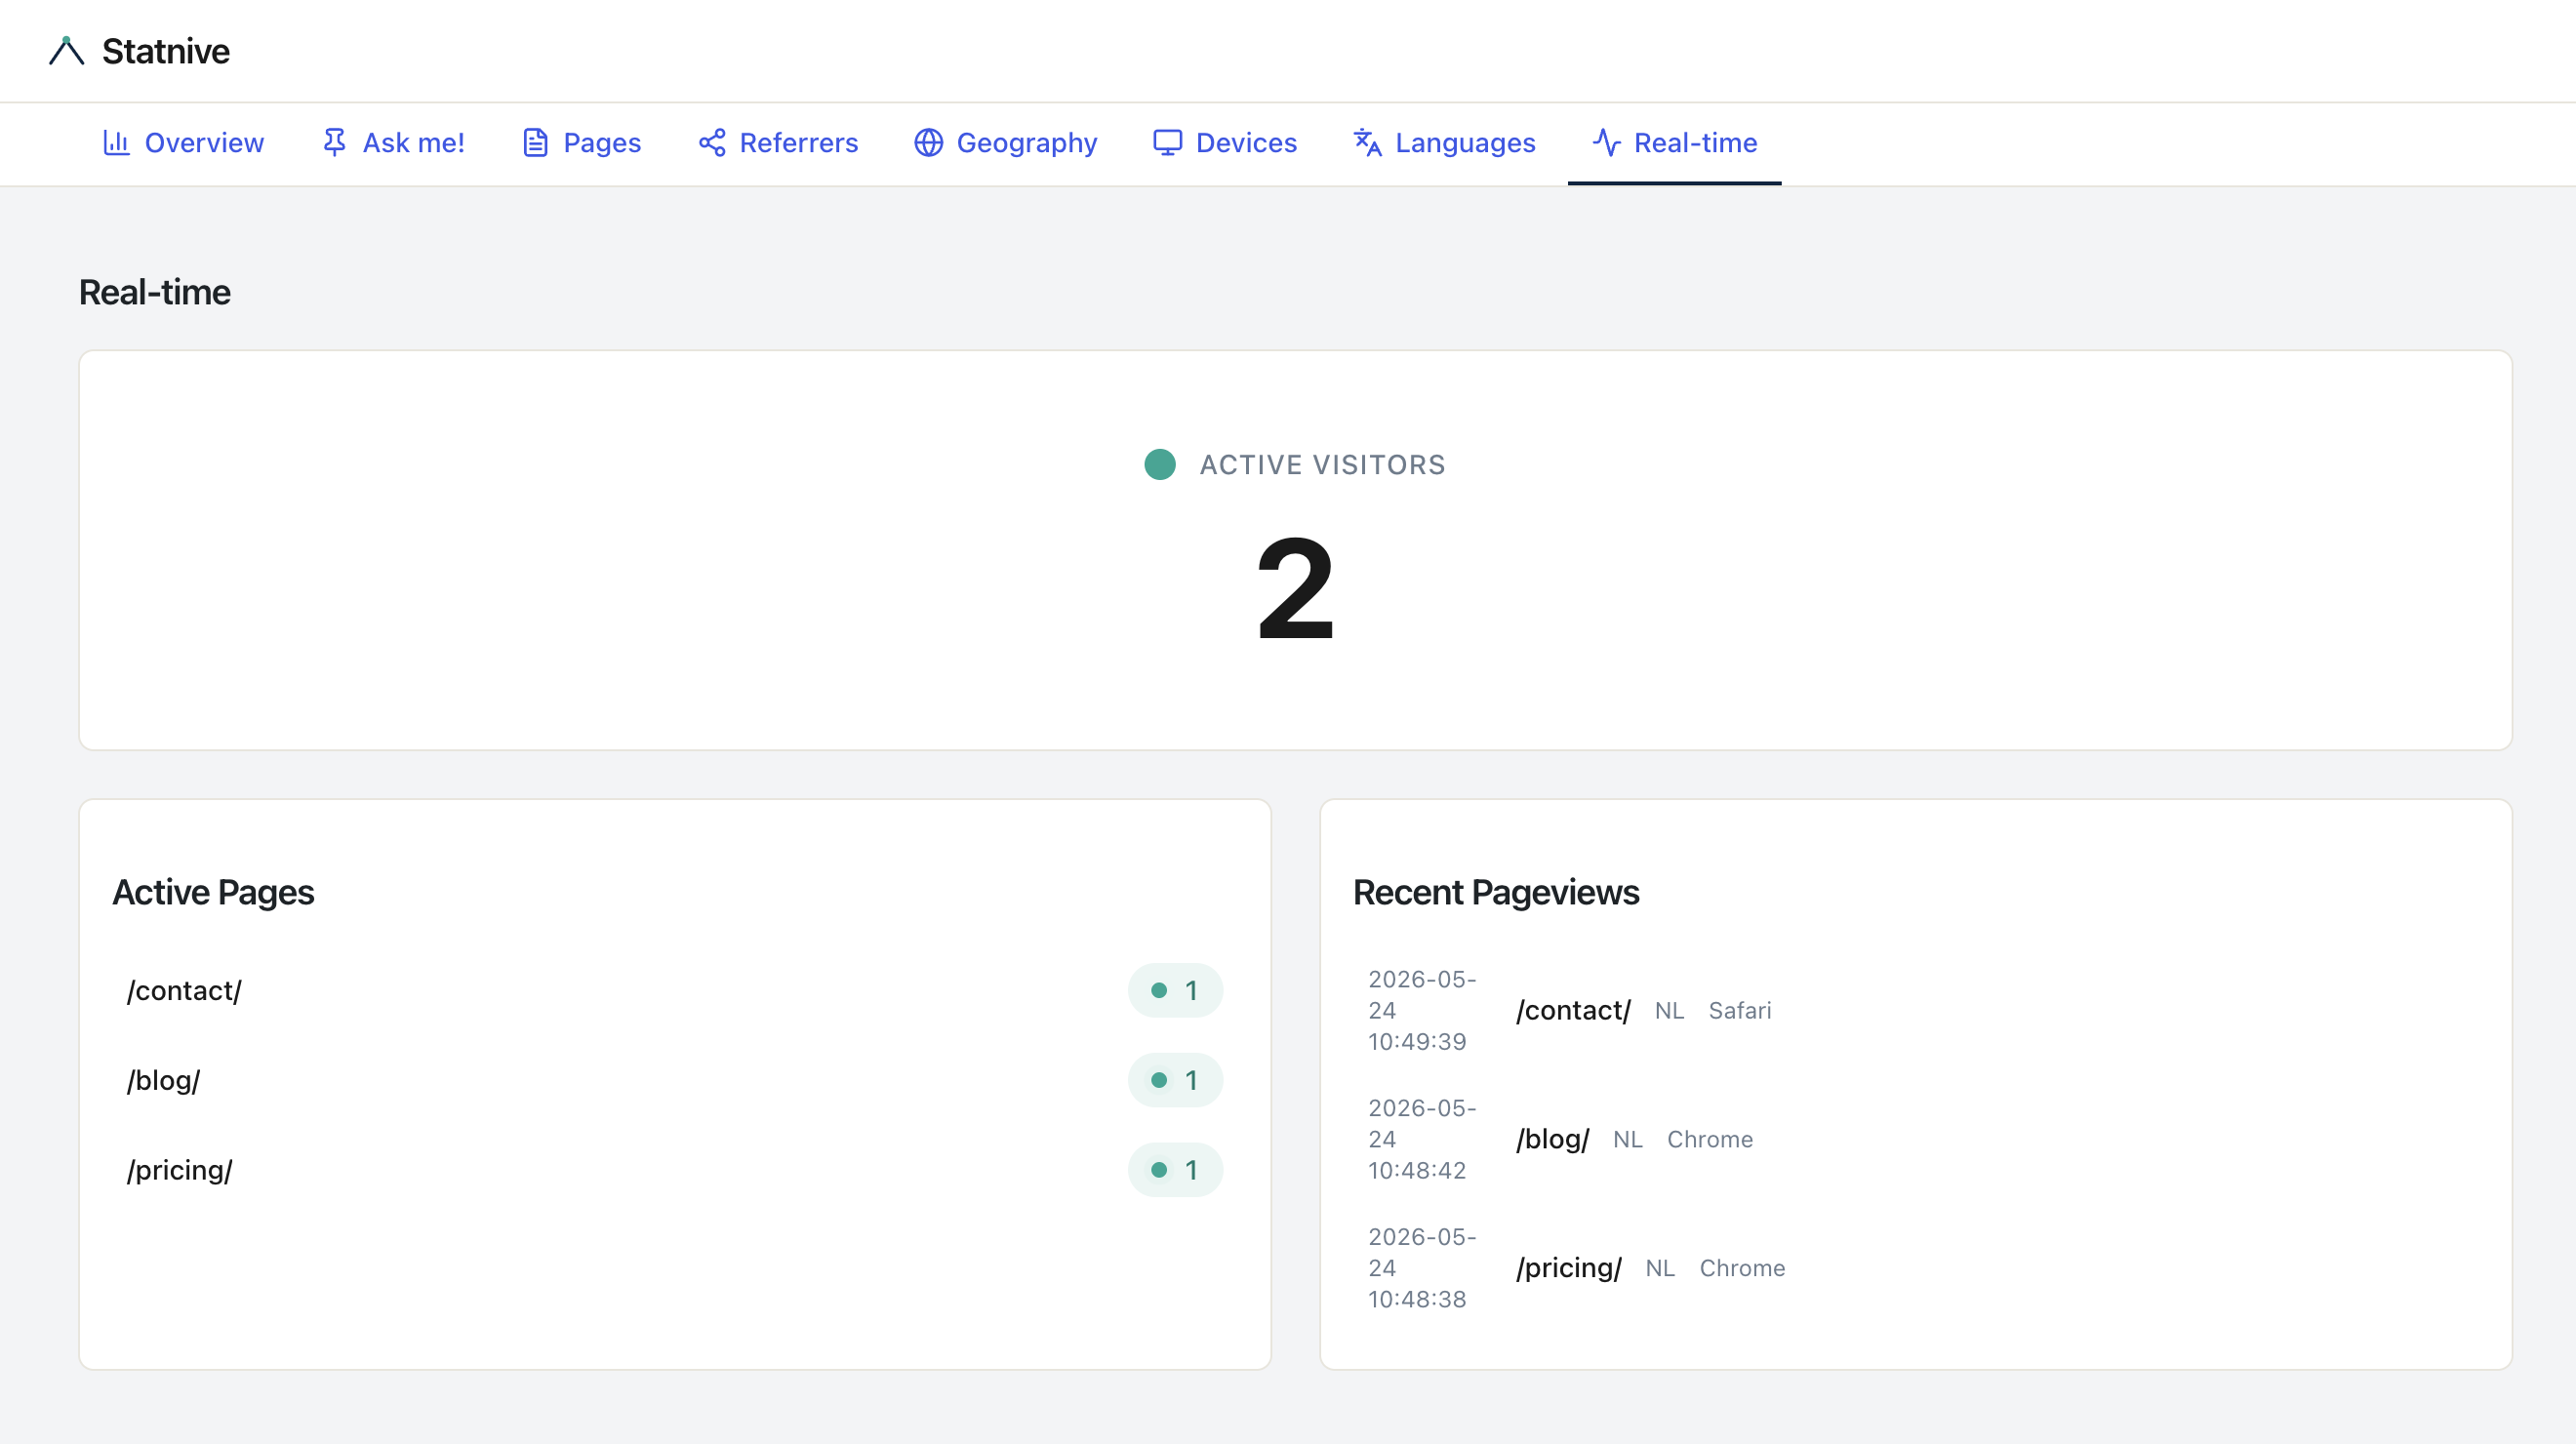
The 60 minutes after you hit send on a flash-sale email is the most psychologically expensive time in a solo WooCommerce owner’s month. You watch the Real-time view. You see zero. You see two. You see four. You see zero again. Did the link break? Is the email in spam? Should you re-send to a different list segment? Should you discount more?
The answer to almost all of those questions is: wait. Real-time is a monitoring tool, not a decision tool. The 24-hour attribution report is where decisions get made.
This post is the operating rhythm that prevents launch-day panic — and the specific things Real-time CAN and CAN’T prove in the first hour.
What this post answers
- The 4 things Real-time can prove in the first 15 minutes of a launch.
- The 4 things Real-time can NOT prove (and the decisions you should not make from it).
- The 4-checkpoint rhythm (5 / 15 / 60 / close-the-tab) that avoids refresh fatigue.
- How to read “Active Visitors” vs. “Active Page Visitors” during a launch.
- The diagnostic value of a Real-time showing zero — and what to do.
What Real-time CAN prove in the first 15 minutes
Four signals are actually decision-grade within the first 15 minutes of any launch:
Signal 1 — The link works
You hit send. Real-time spikes from baseline to your expected level within 5 minutes. The link is alive, the page is loading, email-platform delivery is functional.
If Real-time stays flat, the link is broken, the email is in spam, or the page is down. This is the most-valuable single signal Real-time gives you — the early-warning that something failed.
Signal 2 — Geography matches your audience segment
You sent to your French segment. Real-time shows visitors from France, Belgium, and Switzerland. The targeting is firing correctly.
If Real-time shows the wrong countries (you sent to French segment but visitors are from US/UK), your email-platform segmentation is misconfigured. You’ll want to pause future sends to that segment until you fix it.
Signal 3 — The channel is the one you launched
Statnive’s Referrers report updates Real-time too. You sent an email; Real-time should show traffic from Email + the UTM source you tagged. If you also ran a paid ad simultaneously, you should see Paid Social or Paid Search firing.
If the wrong channel dominates Real-time (you sent an email but Real-time shows mostly Organic Search), either your email link UTMs are stripped (some clients break parameters) or there’s a parallel source you didn’t expect.
Signal 4 — No traffic spike = something is broken
This is the negative space. You expected 500 visits in the first 30 minutes; Real-time shows 12. Something is wrong — at the email-platform layer, the link, or the landing page. Investigate immediately.
The hardest version: you expected 500, you got 200. Within normal variance (open-rate fluctuation, time-zone segmentation, weather affecting click-through), or genuinely under-performing? Wait for the 1-hour and 24-hour data before deciding. First-15-minute under-performance is noise below ~30% of expected.
What Real-time CANNOT prove (and don’t try)
The mirror image — things owners try to read from Real-time that the data won’t support:
Cannot 1 — Sales attribution
Real-time shows visitor counts, not orders. Visitors landing on /sale/ haven’t bought yet; their purchase happens minutes-to-days later. Don’t compute conversion rate from the first hour’s visitor count. Don’t claim “the campaign isn’t converting” based on Real-time.
Cannot 2 — A decision basis
The first hour of a launch over-indexes on your most-engaged segment (fastest email openers, mobile-data customers, time-zone-aligned audience). Their behavior is not representative of total campaign performance. Decisions about scaling, killing, or adjusting wait for the 24-hour data.
Cannot 3 — A basis for on-the-fly copy or creative changes
The temptation: “Real-time shows 50% bounce. Let me change the headline mid-flight.”
Don’t. You change the headline; now you can’t attribute the change. You changed two things (the launch itself + the headline) and lost the ability to learn from either.
Cannot 4 — A substitute for proper UTM tagging
If your email link doesn’t have UTM parameters, Real-time will show traffic as Direct. You’ll think the email failed when it actually fired. UTM discipline (per Post 6) is what makes Real-time legible during a launch.
The 4-checkpoint launch rhythm
Open Real-time. Set a timer. Check at four specific times. Close the tab between checkpoints.
Checkpoint 1 — Minute 5
What to check: is Real-time non-zero? Does the geography match your target audience? Are the channels firing?
What to do: if YES across all three, close the tab. Set the next timer.
If anything is wrong, debug now — click your own email’s CTA, verify the link, check email-platform delivery.
Checkpoint 2 — Minute 15
What to check: is traffic sustained or did it spike-then-die? What’s the bounce rate looking like (Real-time shows it on the per-page view)?
What to do: if sustained, close the tab. If spike-then-die at minute 15, you have a one-segment problem — the early-openers came and went; check whether your email reached the rest of the list (delivery rate in your ESP).
Checkpoint 3 — Minute 60
What to check: is the orders-tail starting? Open WooCommerce → Orders, last hour. Are orders showing up at roughly the rate you expected from the traffic?
What to do: if orders are flowing, close everything and walk away for 6-24 hours. If orders are zero despite hundreds of visits, something is broken in the funnel between landing and checkout — but you still don’t decide from one-hour data. Note the discrepancy and check again at 24 hours.
Checkpoint 4 — 24 hours later (the decision checkpoint)
What to check: the 24-hour aggregate. UTM-tagged sessions, orders by source, conversion rate by source, geographic distribution. This is the decision artifact.
What to do: if the campaign worked, capture the learnings (which segment converted best, what UTM combination drove revenue). If it underperformed, run the diagnostic from Post 6 (Wilson-score kill threshold) — but only on the 24-hour data, not the first-hour data.
The refresh-fatigue anti-pattern
Three signs you’re in the anti-pattern:
- Refreshing Real-time every 30 seconds.
- Panicking at any dip (“we lost 5 visitors in the last refresh — is the link broken?”).
- Making campaign changes in the first hour (“conversion is 0% — let me cut the price!”).
The cost: you change the campaign mid-flight, you can’t attribute the result. You burn cognitive bandwidth on a non-decision. You make panicked decisions that cost more than the campaign’s worst-case underperformance would have.
The fix: the 4-checkpoint rhythm above. Set timers. Close the tab. Trust the data to accumulate. The 24-hour view is the truth; the 5-minute view is theater.
When Real-time saves you money
Three scenarios where Real-time is the high-leverage signal:
- Email-platform deliverability failure. Your email landed in Promotions / Spam for your largest list segment. Real-time at minute 5 shows ~10% of expected traffic; you check the ESP and see the bounce rate is 70%. You can pause the rest of the send (segmented sends rarely fire all at once) and triage deliverability before burning more list reputation.
- Wrong-landing-page link. You promoted a specific product but your email link points to
/shop/instead of/product/specific-thing/. Real-time per-page shows visitors landing on/shop/instead of the product page. You can email a corrected link to the rest of the list within the first 15 minutes. - Ad-platform approval delay. You launched a Meta ad simultaneously with the email. Real-time shows email traffic firing but no Paid Social. Check Meta’s ad-status dashboard — the ad is “Under Review” and won’t go live for hours. You can adjust the budget or wait.
In all three, the 5-15-minute Real-time check catches a problem that 24-hour attribution would only reveal after the damage compounded.
Building the launch dashboard for next time
After 2-3 launches following this rhythm, you’ll have an internal sense of what “normal” looks like. Pin it down by recording:
- Expected first-hour traffic per send size (e.g., 5K-list = 200-400 first-hour visits).
- Expected geography mix.
- Expected channel attribution split (email vs. paid social vs. organic during the launch).
- Expected first-hour bounce rate.
After 3-4 launches, your “normal range” tells you when Real-time is signaling a problem vs. just variance. That’s the long-game value of monitoring rhythm — building intuition for your store’s launches specifically, not generic ecommerce benchmarks.
What v1.0.0 adds, and what’s still a two-tab workflow
As of v1.0.0 (May 2026), the Revenue Report aggregates the first-hour numbers (Orders, Revenue net, AOV, Top Products, per-channel revenue) so you can do the 24-hour checkpoint inside one Statnive tab instead of bouncing to WooCommerce → Orders.
What stays two-tab during the first hour itself: the Real-time report shows live visitor counts but not a per-second order ticker. For an order-by-order live feed in the first 60 minutes, WooCommerce → Orders (Auto-refresh) still wins. Use Real-time for traffic shape, Revenue Report for the rolled-up Orders/Revenue/AOV at the 60-min and 24-hour checkpoints.
What to do next
- Before your next launch, write your “expected first-hour” numbers down. Send size, expected traffic, expected geography, expected channel mix.
- Set the 4-checkpoint timers in your phone (5 min, 15 min, 60 min, 24 hours).
- Run the launch. Hit each checkpoint. Close the tab between them.
- After 24 hours, run the diagnostic from Post 6 on the aggregated data.
- For the broader CRO loop, see the pillar on Privacy-First Analytics for WooCommerce CRO.
Real-time is the smoke detector. The 24-hour report is the fire investigation. Stop confusing the two.