The 10-Minute Weekly WooCommerce Analytics Review
Open Statnive, answer 5 questions, decide one thing. The exact weekly checklist a solo WooCommerce owner can run in 10 minutes — no GA4, no Looker, no agency report. Print it, tape it to your monitor, do it every Monday.
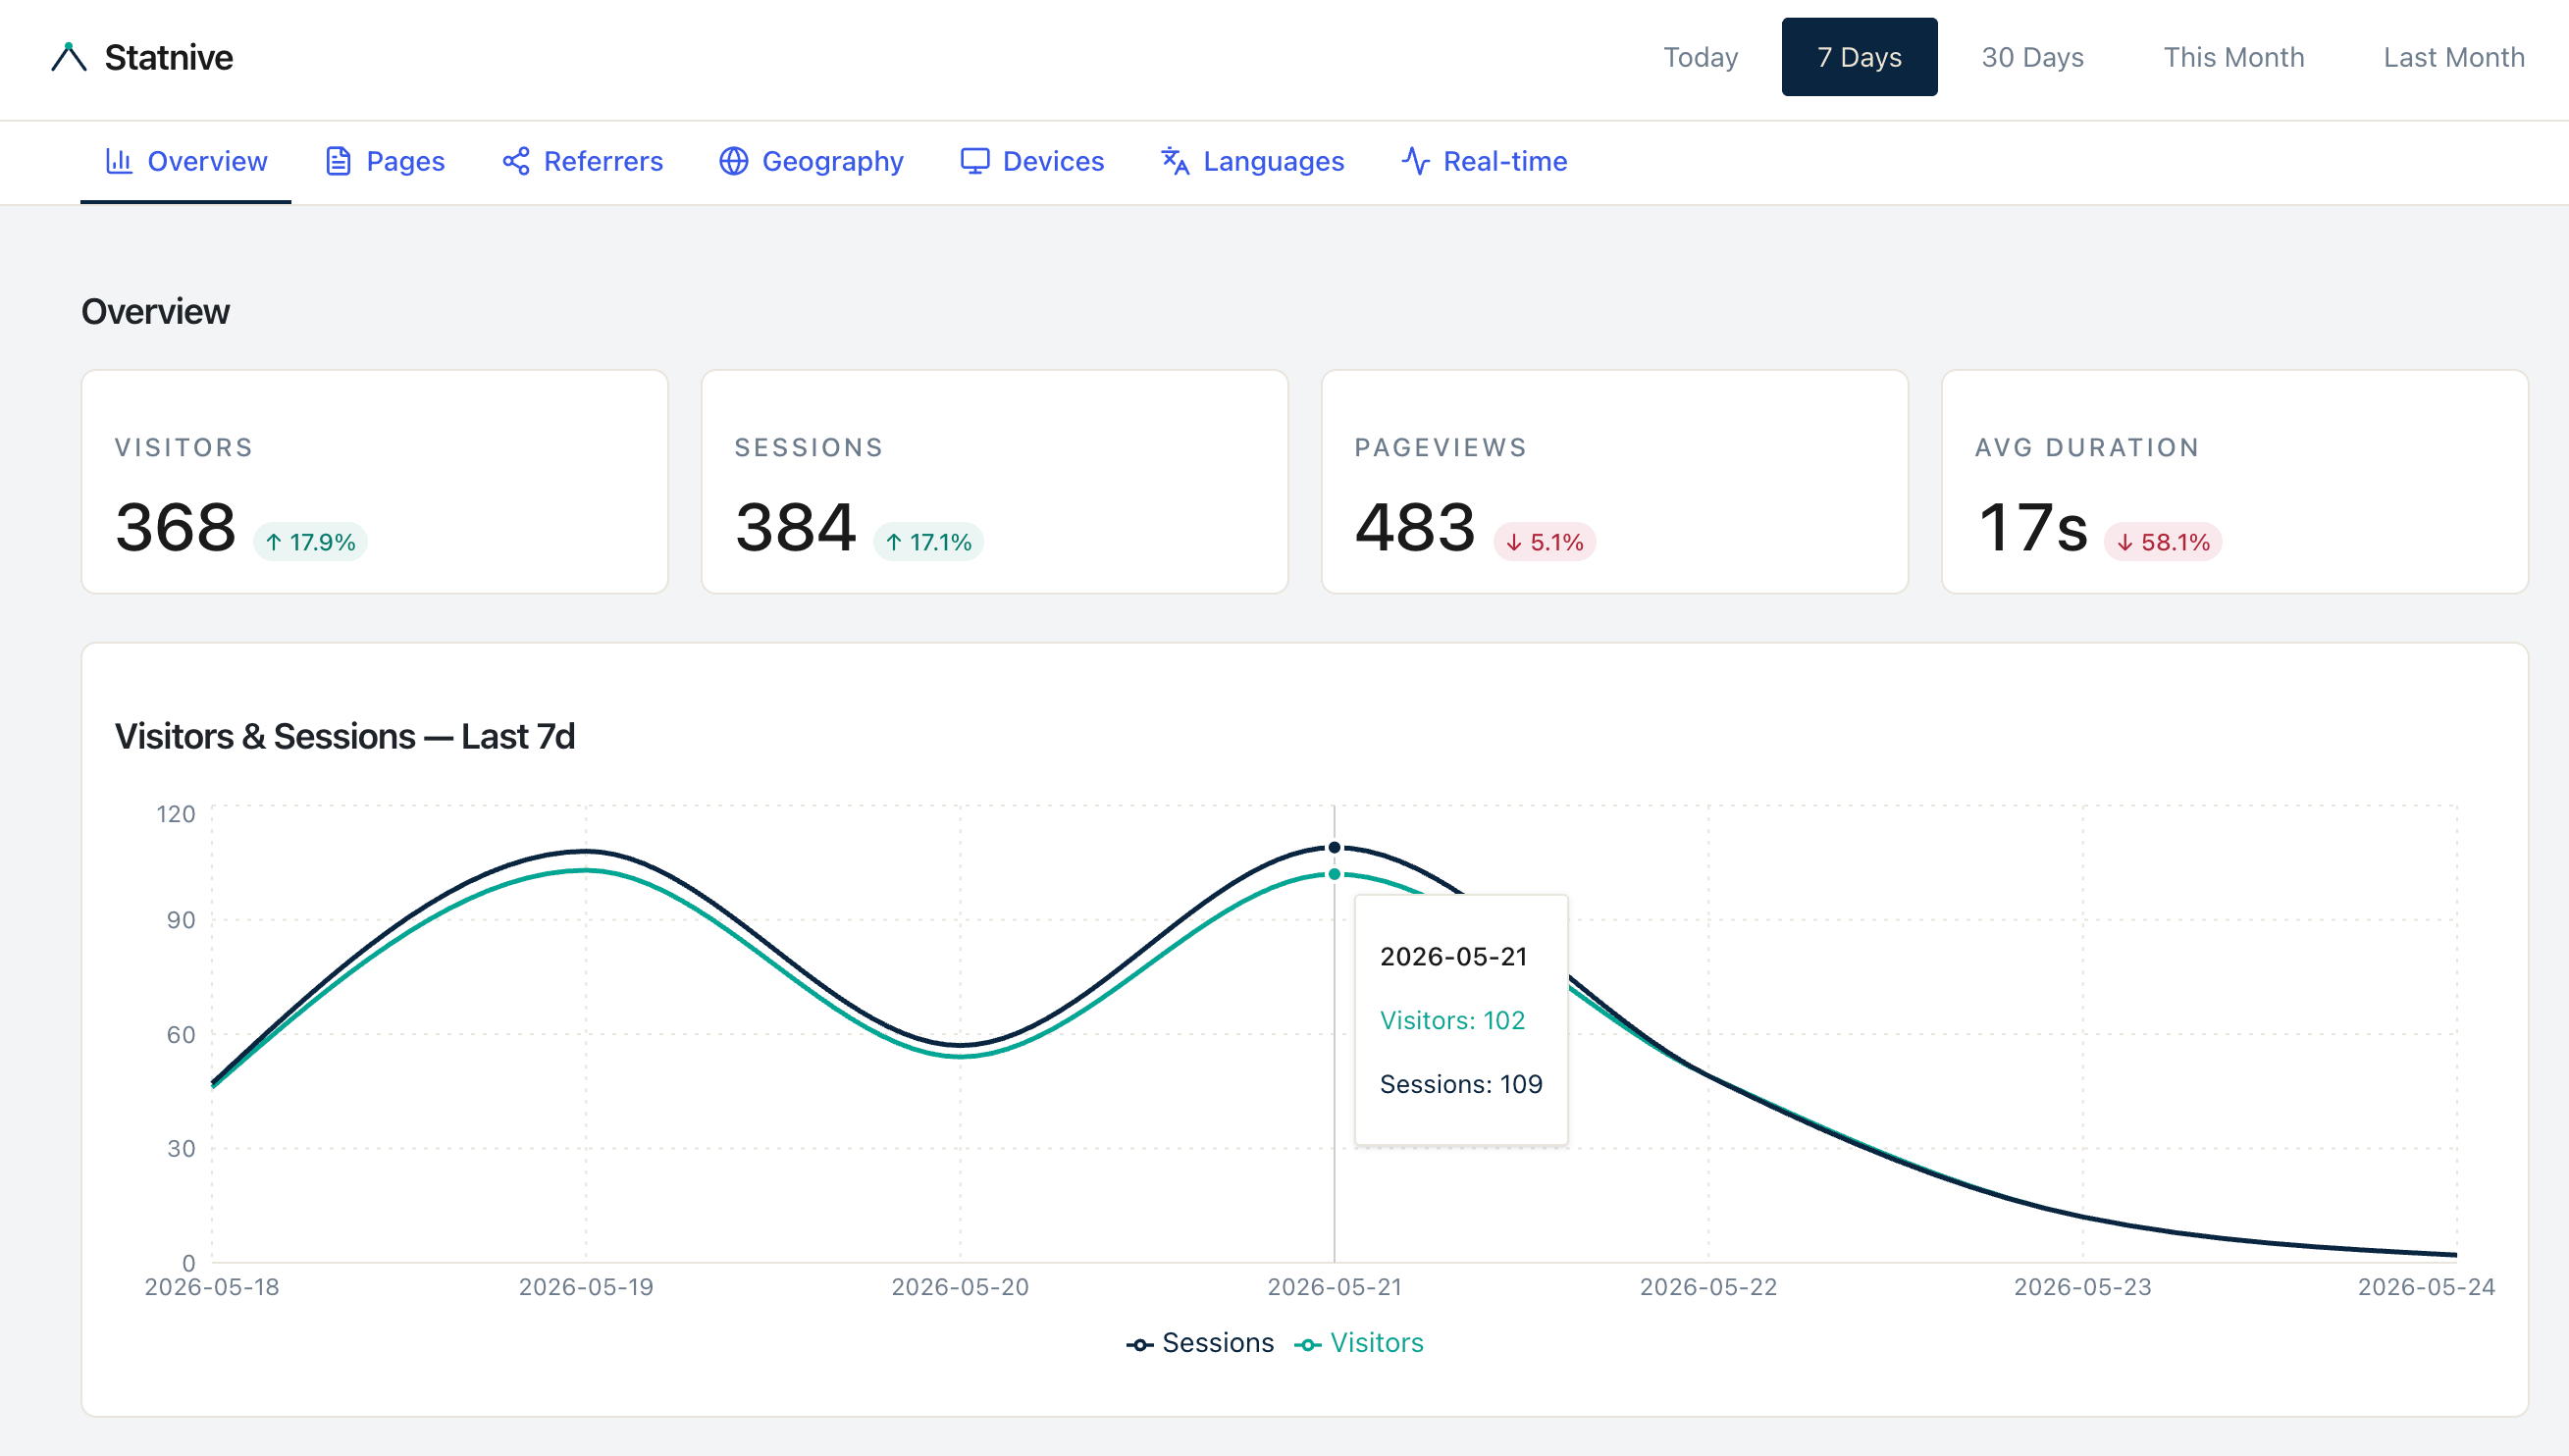
You have 10 minutes on Monday morning. You can either look at five numbers and decide one thing — or open Google Analytics 4, get lost in the dashboard, close the tab, and feel guilty about not doing analytics.
This post is the antidote: a five-question checklist you can run in Statnive in 10 minutes flat. No tabs of charts. No agency report. No “monthly executive summary” template. Print it. Tape it to your monitor. Run it every Monday.
It is also the operating ritual that ties together everything in the 12-post WooCommerce CRO sprint — each question maps to a deeper pillar post if you want to go further. But the weekly read takes 10 minutes regardless.
What this post answers
- The 5 questions to ask your Statnive dashboard every Monday morning.
- The exact decision rule that goes with each question.
- The single experiment per week you should commit to (and why one is enough).
- What you can skip if your sessions are below 500/month, and what you cannot.
The 10-minute weekly checklist
Open /wp-admin → Statnive. Start a 10-minute timer. Answer five questions. Decide one thing. Ship one change.
Question 1 — Did anything change week-over-week?
Where: Statnive → Overview report. Compare last 7 days vs. previous 7 days.
The decision rule: if any single channel’s share of total sessions shifted by more than 25% week-over-week, flag it for Question 2. Otherwise move on — most weeks nothing changes, and that is useful information too.
What to look for, in priority:
- Sudden bounces climb on a previously-healthy channel = quality drop. Diagnose Question 2.
- Sudden traffic spike with bounces near 100% and duration near zero = bot wave. Likely safe to ignore; if it persists, exclude in Statnive’s Exclusions settings.
- Sudden traffic drop on a normally-stable channel = something broke (your indexing, your email link, your ad campaign approval). Diagnose immediately.
Time: 2 minutes.
Question 2 — Which channel is sending qualified visitors this week?
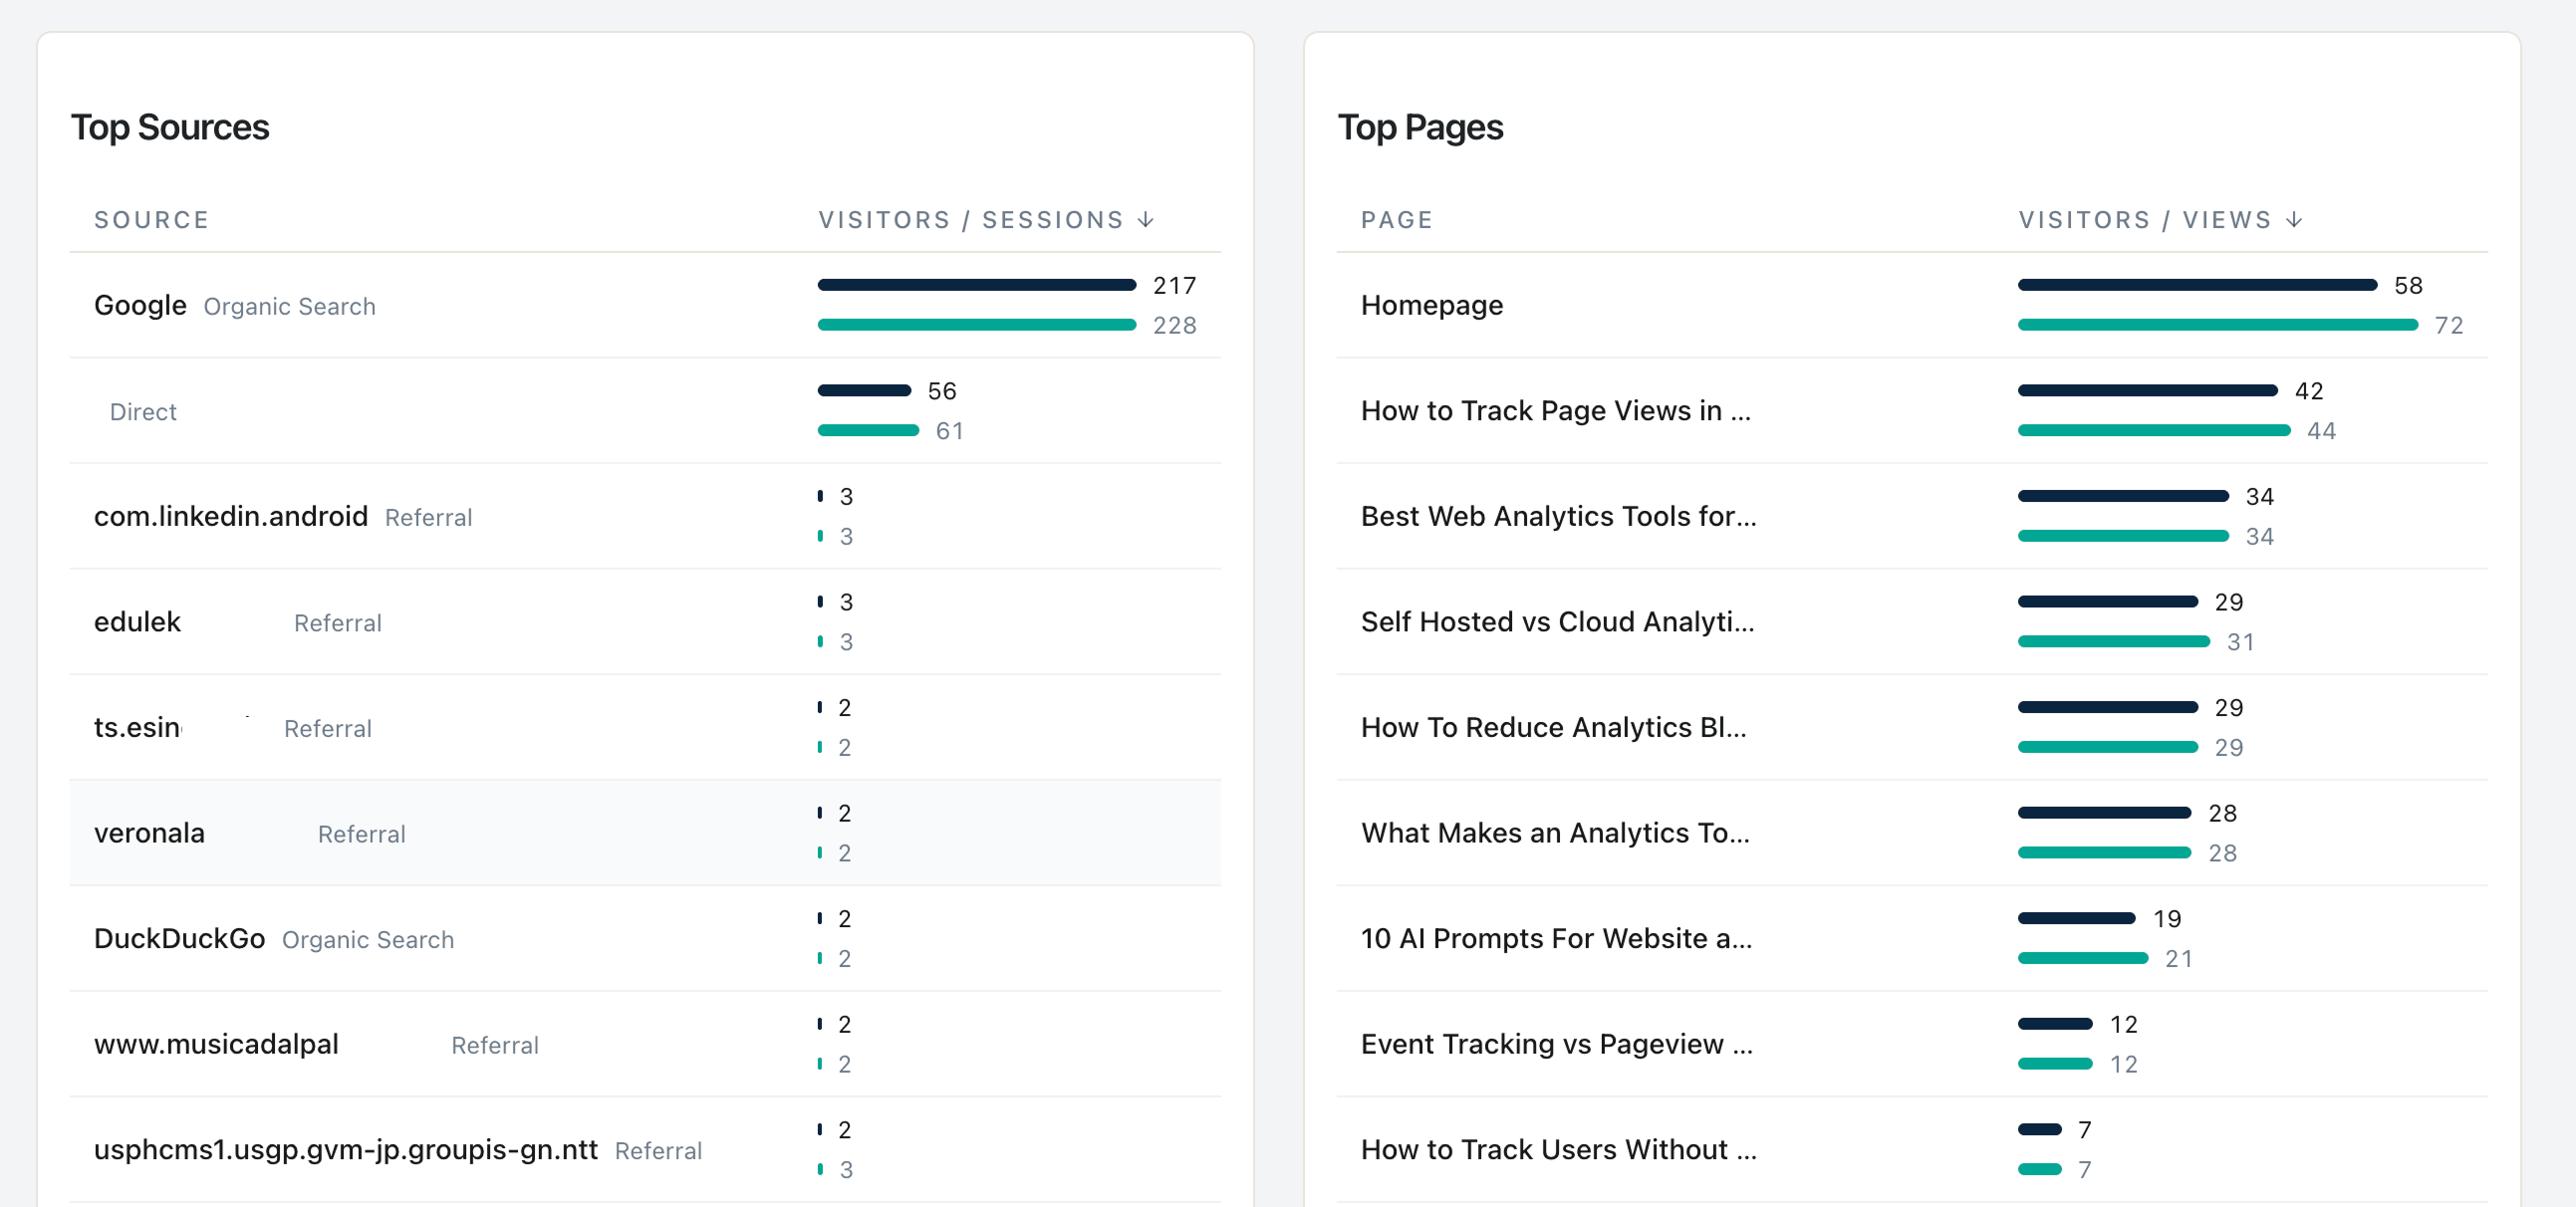
Where: Statnive → Referrers report. Sort by Sessions descending. Look at Bounces and Total Duration columns.
The decision rule (the channel-health rule from Post 2): a channel is healthy if its bounces are at or below the site average AND its duration is at or above the site average, with at least 50 sessions in the last 7 days. Channels failing both halves are flagged for diagnosis — not pause, diagnose.
The three caveats nobody mentions: compare against an intent-matched cohort (paid landing pages vs. other paid landing pages, not vs. your blog average); require ≥50 sessions in a 7-day window before drawing a conclusion; frame failures as “first to diagnose” not “first to pause.”
What to look for:
- One Tier-1-volume channel (Direct, Organic Search, or Email) underperforming = your most expensive miss.
- AI Assistants traffic (Statnive’s distinct bucket — GA4 routes this to Direct or Organic) trending up = a sign your content has been picked up by ChatGPT/Claude/Perplexity. Watch the absolute pattern, not the percentage.
Time: 2 minutes.
Question 3 — Which page is losing the most absolute visitors?
Where: Statnive → Pages report. Sort by Exit Count descending — not exit rate. Pick the top page that is not a thank-you page, contact-form confirmation, or search-results page.
The decision rule (the absolute-loss math from Post 3): the page at the top of the Exit Count list is your priority — even if other pages have “worse” exit rates. A page with 10,000 views and 45% exit rate loses 4,500 sessions; a page with 500 views and 90% exit rate loses 450. Fix the first.
Which exit pattern is it?
- PDP exit: trust gap, info gap, mobile UX failure. See Post 3’s PDP fix list.
- Cart exit: shipping shock (39% per Baymard). Show landed cost on the PDP.
- Checkout exit: form too long, password required, payment provider mismatch. See Post 3’s checkout fix list.
Time: 2 minutes.
Question 4 — Is mobile underperforming desktop?
Where: Statnive → Devices report → look at Mobile vs. Desktop Sessions and Bounces. WooCommerce → Analytics → Orders → check mobile-attributed orders.
The decision rule (from Post 5): compute mobile_CR ÷ desktop_CR. Baseline is roughly 0.60–0.74. If your ratio is below 0.50 and your mobile share is above 60%, you have a real mobile UX problem and it is the highest-leverage single fix you can ship this week.
Decision shortcuts:
| Ratio | Interpretation | This week’s action |
|---|---|---|
| ≥0.70 | Within normal range | Skip — no urgent mobile fix |
| 0.50–0.69 | Slight underperformance | Note for next quarter’s audit |
| Below 0.50 | Material problem | Mobile becomes Question 5’s experiment |
Time: 2 minutes.
Question 5 — What experiment do I run this week?
Where: in your head, with the data from Questions 1–4.
The decision rule: pick one change. Frame as a hypothesis: “If I change [X], then [metric] will improve by [Y] because [signal from Questions 1–4].” Ship it. Note the date. Come back next week for the read — but evaluate the experiment at the 30-day mark, not weekly.
The “one change” principle (from Post 1’s CRO pillar): running one change at a time means you can attribute the result. Running three changes at a time means you can attribute none of them. For a solo Woo store under 1,000 sessions per page per month, attribution discipline matters more than test velocity.
Time: 2 minutes.
Total: 10 minutes. One read. One hypothesis. One change shipping this week.
The printable checklist
For your monitor or your weekly-review notebook:
WOOCOMMERCE WEEKLY ANALYTICS REVIEW — 10 MINUTES

□ 1. OVERVIEW — any channel share shifted >25% WoW?
     If yes → flag for Q2.

□ 2. REFERRERS — does any top-3-volume channel fail the
     channel-health rule (bounces ≤ avg AND duration ≥ avg,
     ≥50 sessions)?
     If yes → diagnose, do not pause.

□ 3. PAGES — what's the #1 page by Exit Count (not rate),
     excluding thank-you / contact / search?
     Identify which exit pattern: PDP / cart / checkout.

□ 4. DEVICES — what's mobile_CR ÷ desktop_CR?
     below 0.50 = material mobile problem, becomes Q5.

□ 5. EXPERIMENT — pick ONE change.
     "If I change [X], then [metric] will improve by [Y]
     because [signal]." Ship it. Date it.
     Re-evaluate at 30 days, not next week.

──────────────────────────────────────────────
Total time: 10 minutes. Sips of coffee allowed.
Save this as a .txt file. Open it every Monday. Run it. Then close it and go ship the experiment.
What you can skip if you’re under 500 sessions/month
For very small stores, statistical noise drowns out signal. The reduced rhythm:
- Skip Question 4 (Devices) for any week with mobile sessions below 50. The denominator is too small to read mobile-vs-desktop reliably; revisit monthly instead.
- Run Question 2 (Referrers) at the channel-bucket level only — sub-channel UTM analysis is noise below 500 sessions/week per channel.
- Keep Questions 1, 3, and 5 verbatim — even at low volume, week-over-week direction and absolute exit count are still meaningful signals.
What you cannot skip, ever
Three things every solo Woo owner skips and regrets:
- The actual experiment commit (Question 5). Reading the data without shipping a change is the most expensive form of procrastination. One imperfect experiment per week compounds; zero perfect experiments compound to nothing.
- The 30-day re-evaluation of last month’s experiment. Set a calendar reminder when you ship the change. Otherwise the experiment runs forever and you never learn whether the change worked.
- The Monday cadence itself. The 10-minute review during a “quiet week” is when you spot the early signal of the busy week’s problem. Slow weeks are when the pattern is visible. Don’t skip.
What v1.0.0 adds to the weekly review, and what’s still a cross-reference
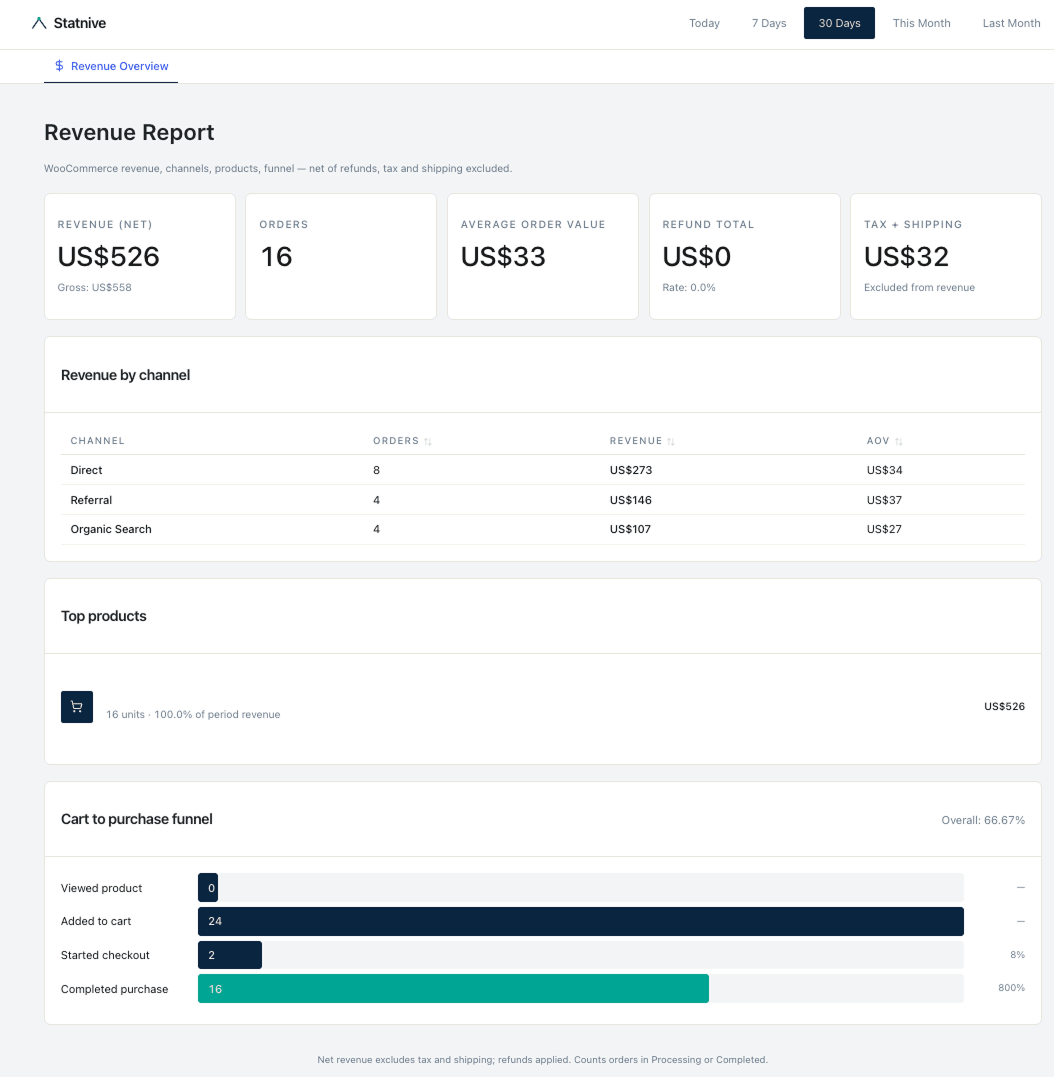
As of v1.0.0 (May 2026), two parts of the weekly review tighten:
- Revenue per channel inside Statnive. The Revenue Report’s Channel breakdown gives you Orders + Revenue + AOV across the same 8 channels Question 2 uses for channel health. The Question-2 rule (bounce + duration) can now be paired directly with revenue-per-session per channel — no more two-tab cross-reference with WC Analytics for the headline number.
- Funnel drop-off across the 4 main stages. The Cart-to-Purchase Funnel shows per-step conversion across
Viewed product → Added to cart → Started checkout → Completed purchase. You see which stage is leaking at the store level in the same 10-minute window.
What stays a cross-reference: per-sub-step inside /checkout (shipping → payment → review → submit) is not surfaced in v1.0.0. For that level of granularity, WooCommerce → Orders → Abandoned Cart (or your checkout-recovery plugin) is still the source.
What to do next
- Print the checklist above. Tape it to your monitor.
- Run the first weekly review next Monday. Time yourself.
- Pick the one experiment. Note the date.
- Come back in 30 days, re-evaluate, run the next week’s review.
- After 8 weeks, you will have spotted patterns no agency report would have surfaced — because you’re the one watching every week.
For the deeper CRO operating system this fits into, see the pillar on Privacy-First Analytics for WooCommerce CRO. For the channel-health rule’s full decision logic, see Post 2’s traffic-source playbook. For the absolute-loss exit-page math, see Post 3’s entry/exit pillar. For the mobile-vs-desktop diagnostic, see Post 5’s mobile-conversion pillar.