How to Use Entry and Exit Pages to Improve WooCommerce Sales
Stop sorting by exit rate. The math nobody on the SERP teaches: views × exit count = the real ranking of where your WooCommerce store loses money. Plus three exit-page patterns (PDP / cart / checkout) and the fixes evidence-backed CRO research actually supports.
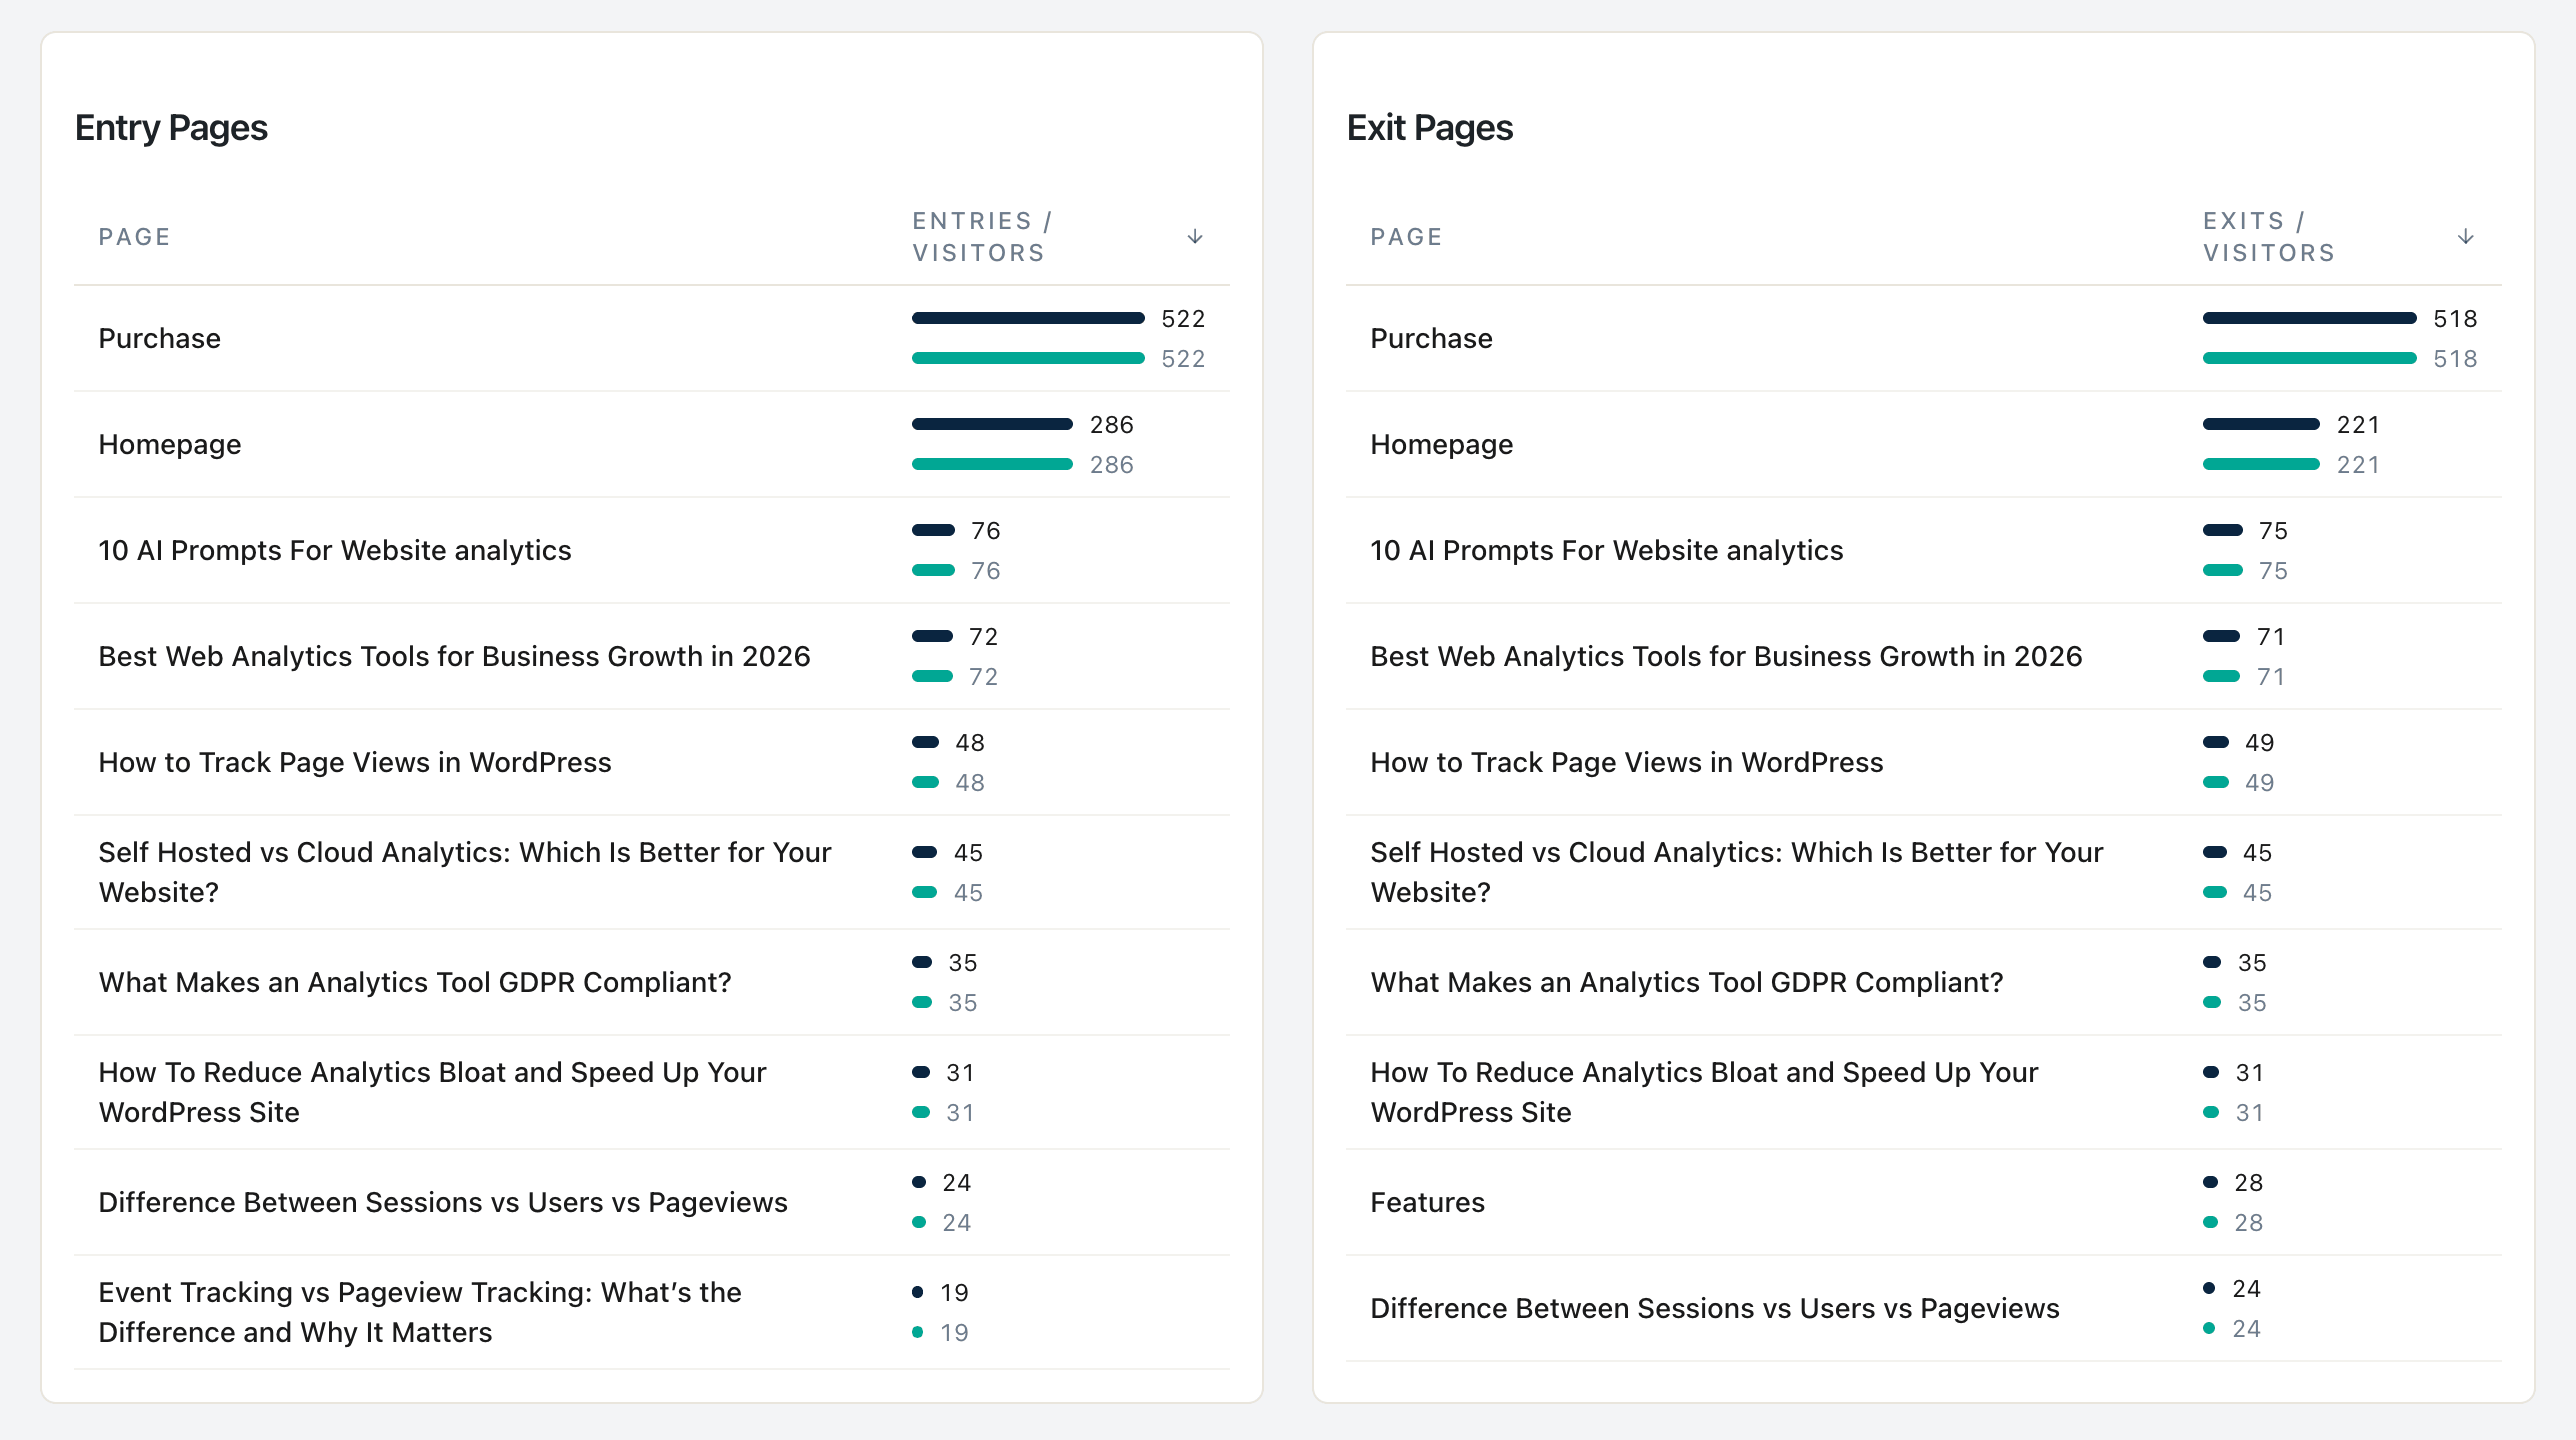
Here is a small experiment. Open your WooCommerce store’s analytics. Find your Exit Pages report. Sort by exit rate, descending. Look at the top result.
It is almost certainly a thank-you page, a tiny landing page nobody visits, or a search-results page with 30 views and one returning user. That is not where you should fix things.
Now sort the same report by exit count — the absolute number of sessions that ended on each page. The top result is almost always a real product page, a cart page, or a checkout step. That is where to fix things.
That switch — from rate to count — is the most leveraged single change a solo WooCommerce owner can make to their CRO process. It costs nothing. It changes everything. And it is the centerpiece of this post.
What this post answers
- Why sorting your exit pages by rate is a trap, and what to sort by instead.
- The bounce-vs-exit distinction nobody actually understands (and the CXL canonical).
- The three exit-page patterns in a WooCommerce funnel (product, cart, checkout) and the evidence-backed fix for each one.
- The four anti-patterns you will see in every other CRO post — and the research that debunks them.
- The WooCommerce-specific gotchas that make standard analytics lie to you on certain themes and checkout configs.
Bounce vs. Exit — the most-confused pair in analytics
Per CXL Institute’s canonical guide, the rule is one sentence: “all bounces are exits, but not all exits are bounces.”
A bounce is a single-page session — someone landed on a page and left without going anywhere else. An exit is the last page someone viewed before leaving, regardless of whether they visited other pages first.
The practical consequence:
- A 100% exit rate on a
/thank-youpage is healthy — the order is done; we want them gone. - A 60% exit rate on
/cartor/checkoutis catastrophic — they got ready to buy and walked away. - A 90% bounce rate on a blog post is fine — the reader’s search query was satisfied.
- A 70% bounce rate on a paid landing page is on fire — the ad spend is wasted.
Always interpret bounce and exit against the purpose of the page, not against the site-wide average. The site-wide average is the mean of a bimodal distribution (informational + transactional) and is therefore wrong for both.
The math: views × exit count = absolute revenue loss
This is the section you will not find in WP Statistics’ exit-pages tutorial, MonsterInsights’ CRO posts, or Independent Analytics’ blog. They all sort by exit rate. That is the trap.
The correct ranking is the absolute number of sessions a page is leaking. Two pages, same store:
| Page | Views | Exit Rate | Exit Count (sessions lost) |
|---|---|---|---|
/product/popular-shirt/ | 10,000 | 45% | 4,500 |
/product/niche-mug/ | 500 | 90% | 450 |
The niche mug has a worse rate. The popular shirt loses ten times more sessions. Fix the popular shirt first. Every fixed session has the same revenue potential; you want to recover the absolute pool, not optimize the rate.
Statnive does this for you implicitly. The Pages report shows Exit Count as a column, not exit rate. Sort it descending, and the top of the list is your priority queue — already weighted by traffic. If you want the rate for diagnostic context, compute it manually (exit count ÷ views), but never use it as the ranking.
The funnel-position tiebreaker, per CXL’s PIE/ICE prioritization frameworks: when two pages have similar exit counts, weight bottom-of-funnel pages higher. A shipping-cost surprise on /cart (lost sale right now) is worth more than a hesitant exit on a blog post (lost sale maybe later, maybe never). A practical multiplier: PDP × 1.2, cart × 1.5, checkout × 1.5 against blog exits at 1.0.
The three exit-page patterns (and the evidence-backed fix for each)
Every solo WooCommerce store leaks revenue at three identifiable places: the product detail page (PDP), the cart, and the checkout. Each has a different fix.
Pattern 1 — Product page (PDP) exits
What it looks like: high entry count, mediocre duration (15–60 seconds), high exit count without add_to_cart events. The visitor read enough to decide “no” and bounced.
Per Baymard’s checkout-usability database, the highest-evidence PDP fixes:
- Trust stack on the page itself. Reviews (95% of buyers read them before purchase per Baymard), a delivery-date estimate (24% lift), a visible returns badge (27% lift). Solo Woo owners under-invest in this constantly because they assume the buyer already trusts them.
- Shipping + price clarity above the fold. Hiding shipping cost until checkout is the single biggest cart-abandonment cause (39% of abandoners). Solve it at the PDP, not at the cart.
- Mobile-first gallery + above-fold CTA. Nielsen Norman Group’s attention research shows 57% of viewing time is above the fold; per Baymard, 71% of users don’t scroll on PDPs at all on mobile. The Add-to-Cart button must be reachable without scrolling on a 375px viewport.
Pattern 2 — Cart page exits
What it looks like: high entry count on /cart (or your custom cart URL), exits ≥40%. They got to the cart and walked away.
The evidence-backed fix list, in priority order:
- Show the full landed cost (product + shipping + tax) on the cart page. Not the checkout. Cart. Baymard pegs this at the #1 abandonment cause, fixing it produces 5–11% conversion lift across their case studies. The “surprise shipping fee at checkout” pattern is the deadliest pattern in WooCommerce.
- True guest checkout, not “checkout, then we’ll ask you to register”. 24% of US abandoners cite forced account creation as the abandonment reason; Baymard’s median lift from adding a real guest checkout is 14%.
- Collapse the coupon field by default, or remove it. 27% of US shoppers report leaving to hunt for a coupon code when they see a prominent coupon field. The field anchors the shopper on “I should be paying less than this” — and they leave to find a code that may not exist.
Pattern 3 — Checkout page exits
What it looks like: shoppers reach /checkout, the exit count is climbing. They started the checkout and bailed mid-form.
Per Baymard’s checkout-flow analysis:
- Reduce checkout to 7–8 form fields. Baymard’s database median is 14.88 fields; cutting to the minimum produces a median 35.26% conversion lift. WooCommerce’s default checkout asks for first name, last name, company, country, address line 1, address line 2, city, state, postal code, phone, email, order notes — 12 fields. Disable the ones you do not need (company, address line 2, order notes, often phone) in WooCommerce → Settings → Accounts & Privacy.
- Match the payment provider the visitor expects. If your visitors are mobile-heavy and EU, that’s Apple Pay + Klarna + SEPA, not “all gateways enabled”. Adding too many options is decision-fatigue.
- Remove password requirement and set the right
inputmodeon each field. 19% of US abandoners cite forced account creation (which usually means “set a password”); offering passwordless checkout (via email link or social) produces a 6–9% lift.
Four anti-patterns to skip
These show up in every “ecommerce conversion optimization” listicle. The research debunks them.
- Hide shipping cost until checkout. This is the #1 abandonment cause per Baymard. Doing it on purpose is self-sabotage. Show landed cost on the PDP, again on the cart, before checkout starts.
- Force account creation before checkout. 24% of US abandoners walk away the moment they see a “Register first” wall. True guest checkout — no account, no password, just a confirmation email — is non-negotiable.
- Add an exit-intent popup to every page. Research is divided. On a blog post or a category page, an exit-intent popup with a relevant offer can lift email captures. On a PDP, cart, or checkout, it is hostile — per NN/g’s overlay research and Speero’s e-commerce tests, exit-intent popups on commerce-intent pages actively reduce conversion and damage brand trust. Skip them on
/product/*,/cart, and/checkout. - Auto-apply site-wide coupons to “recover” abandoning carts. Counter to intuition. Per Baymard and Speero, blanket discounts train the customer to wait, anchor everyone on a lower price, and erode margin without recovering many abandoned carts. Reserve coupons for specific, time-limited offers tied to a specific behavior (e.g., “leave 30 days inactive, then we email a coupon”). Never auto-apply.
WooCommerce-specific gotchas (the ones that make standard analytics lie)
These are the things every analytics tool, including Statnive, sees through a slightly different lens on a real WooCommerce store. Know them before you trust the numbers.
- Thank-you pages create one Pages row per order. WooCommerce’s thank-you URL is
/checkout/order-received/{order_id}/. Each order generates a unique URL. Your Pages report will show hundreds of distinct rows for the same logical page. To count thank-you visits, filter by URL pattern (/order-received/), not by exact slug. - Custom-slug Cart Block + AJAX-drawer themes break the
/cart/pattern. WooCommerce 8.0+ lets you reconfigure the cart URL in Settings → Advanced, and Cart/Checkout Blocks let you inline the cart on the front page (no/cart/URL exists at all). Astra, Botiga, Flatsome, Blocksy, and the modern Storefront use AJAX slide-in cart drawers that never trigger a/cart/pageview. About half of modern WooCommerce stores will not see a/cart/row at all. As of v1.0.0, the Revenue Report’s Cart-to-Purchase Funnel readswc_add_to_cartandwc_checkout_startserver-side from WooCommerce — block-based checkout, drawer-cart themes, and custom slugs are all counted correctly there, independent of pageviews. - Variable-product variants collapse to the parent slug. A variable product at
/product/t-shirt/with?attribute_pa_color=redand?attribute_pa_size=largequery strings tracks as one Pages row, not three. That is the right unit for parent-PDP CRO (“does this t-shirt sell?”) and the wrong unit for variant analysis (“is red selling but blue isn’t?”). Variant-level analysis is still a known unknown in the Pages report — for purchase-level variant data, Revenue Report → Top Products groups under parent, which matches WooCommerce’s own grouping but doesn’t break out per-variant either.
If your analytics report looks “off” in week one, this list usually explains why — and the explanation is theme/config, not the tracker.
The solo-Woo CRO rhythm: one page, one fix, one month
Most CRO advice assumes you have a CRO team and an A/B testing tool. You don’t. Per CXL’s statistical significance guidance, under 1,000 sessions per page per month you cannot reliably reach significance in a reasonable A/B test window. That is fine — it just changes the rhythm.
The rhythm for a sub-1,000-session page:
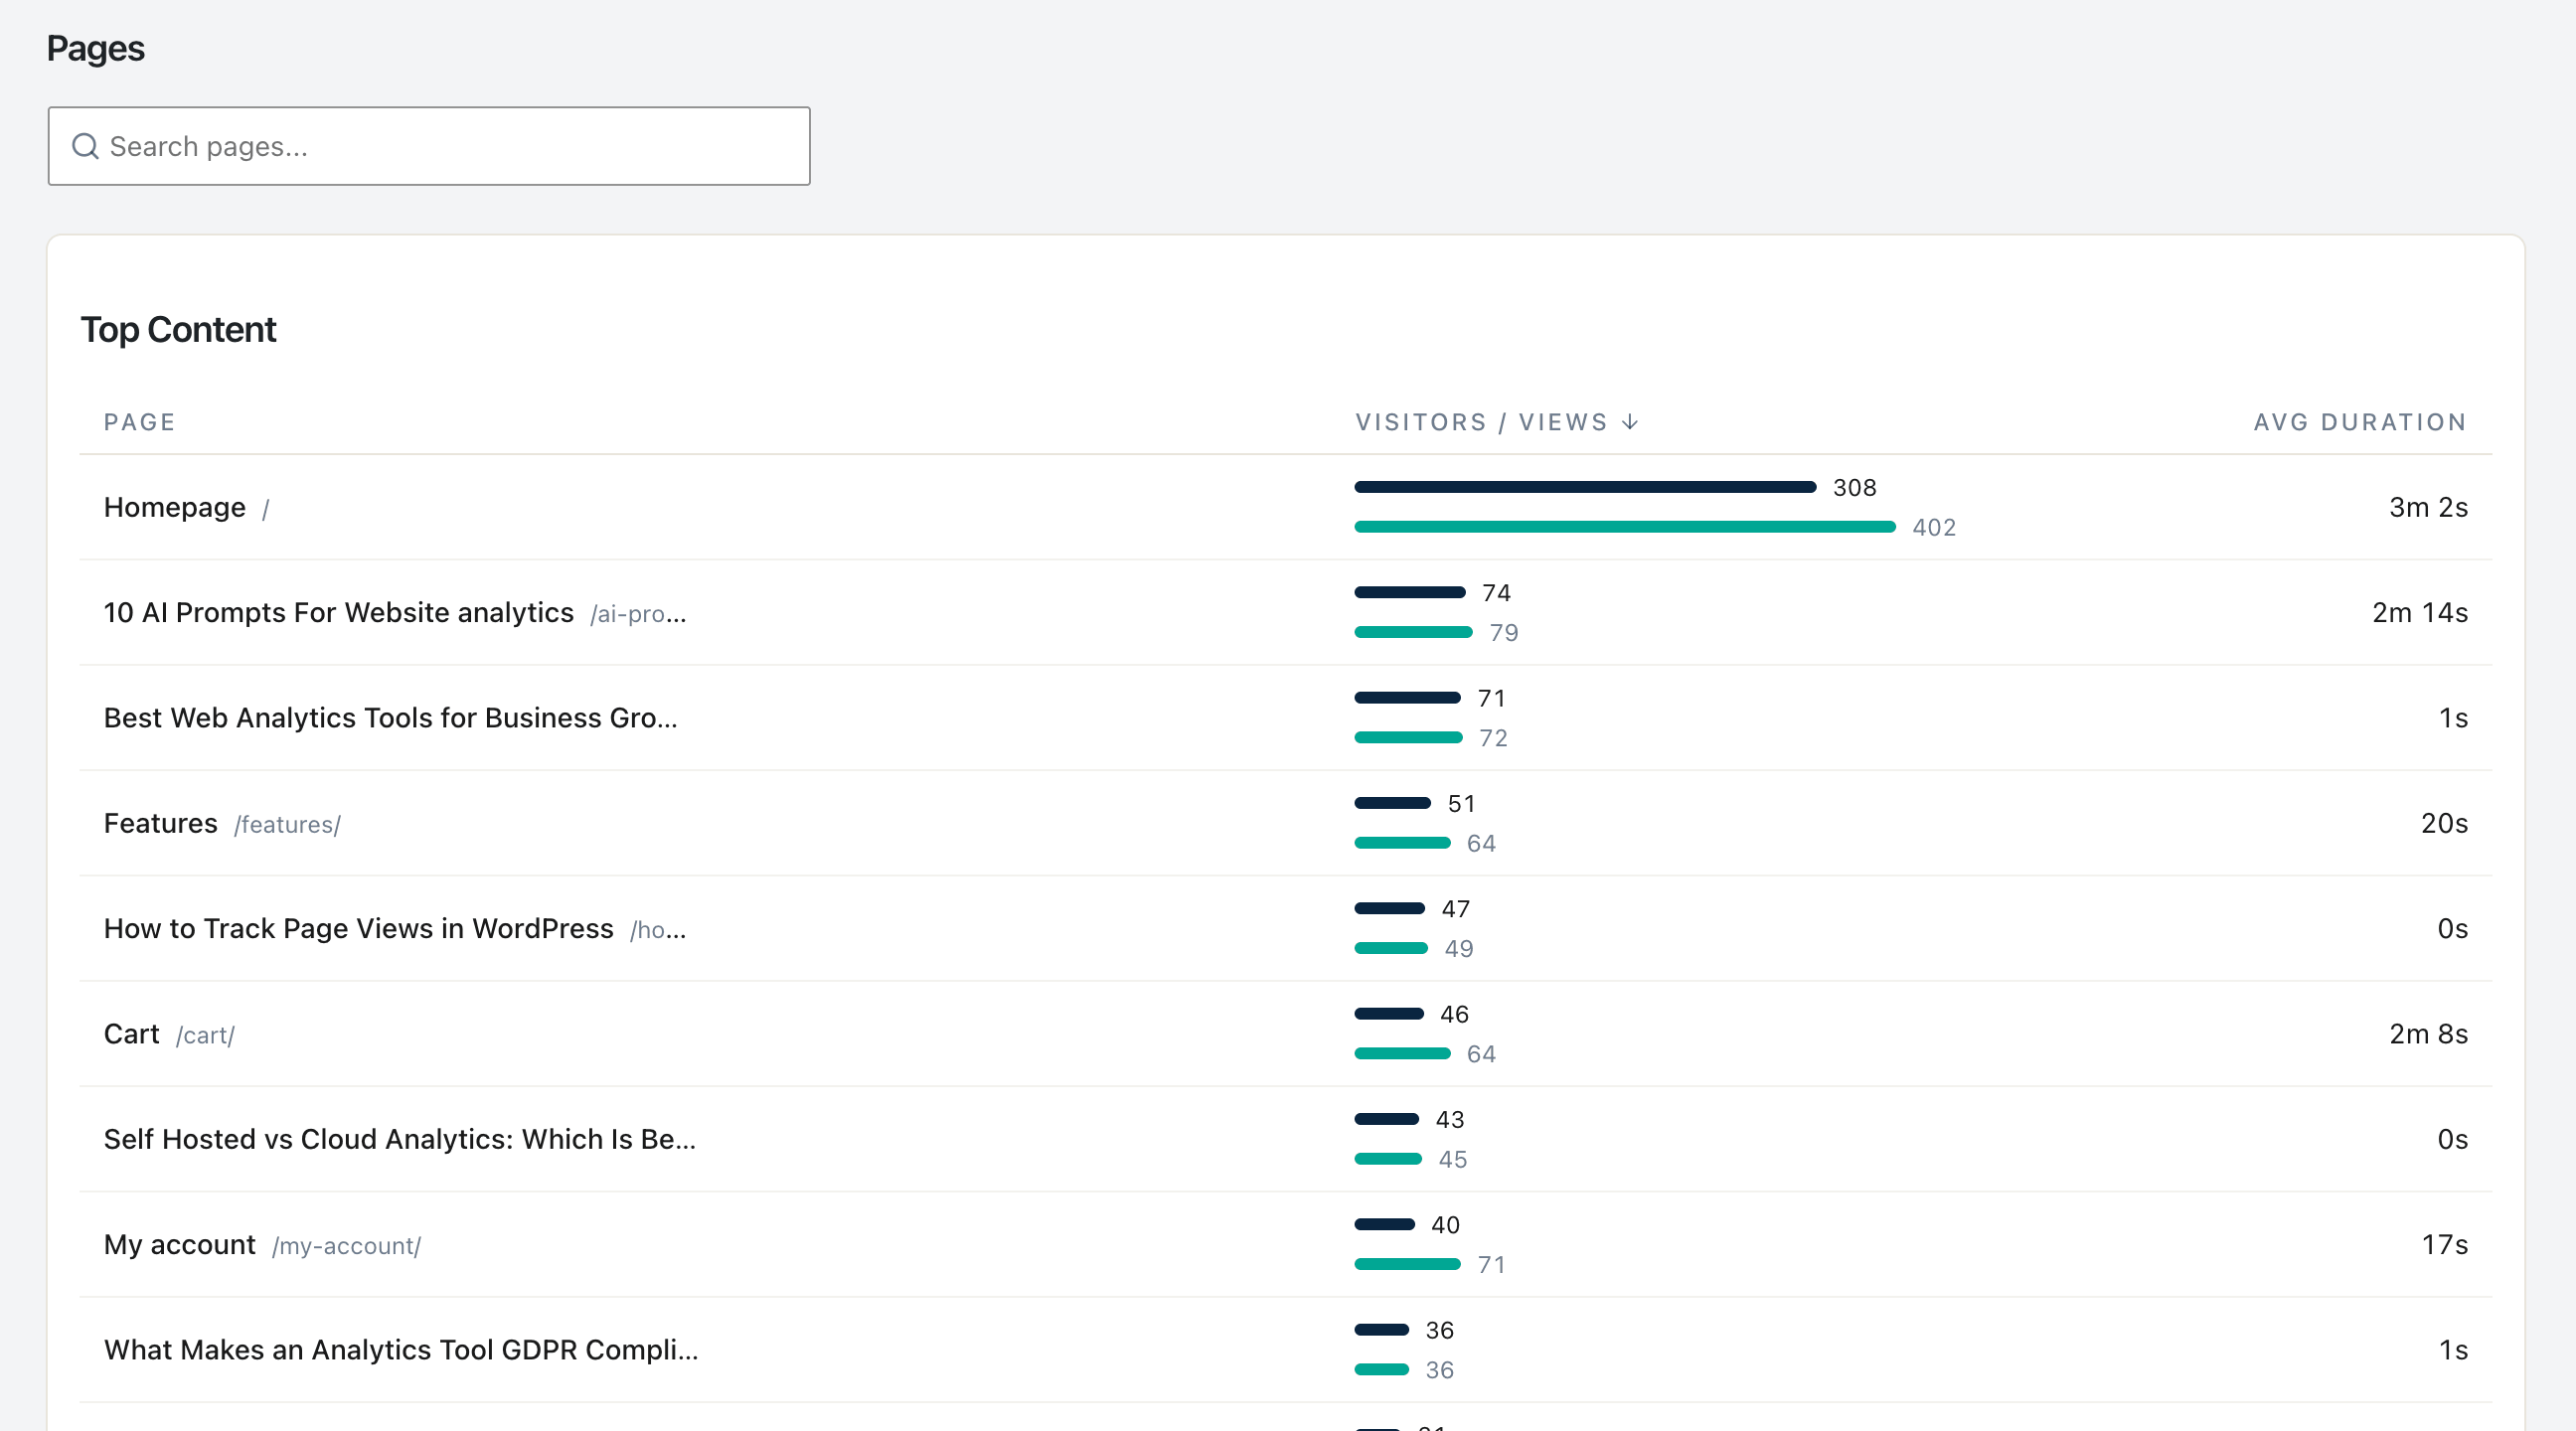
- Sort the Pages report by Exit Count descending. Pick the top page that is not a thank-you / contact-form-confirmation / search-results page.
- Identify which of the three exit-page patterns it fits (PDP / cart / checkout).
- From Baymard’s checklist for that pattern, pick the single highest-evidence fix that you can implement in less than 4 hours.
- Ship the fix on a fixed date.
- Measure 30 days before vs. 30 days after on absolute orders (Woo admin) and on Exit Count for that page (Statnive). If the absolute lift is ≥20%, keep the change.
- Move to the next page on the list.
One page, one fix, one month. Twelve fixes a year. By design, this is slower than the agency playbook and far more credible: at the end of 12 months you have a list of 12 fixes, each with a 30-day before/after on absolute orders, and a real intuition for what moves the needle on your store, not on a Baymard panel of 50,000.
What the v1.0.0 Revenue Report adds
As of v1.0.0 (May 2026), Statnive’s Revenue Report ties exits to revenue directly — historical orders backfill automatically on first open. Two practical gains on top of the absolute-loss math in this post:
- You can join exits with revenue. Sort the Pages report by Exit Count for the diagnostic, then open Revenue Report → Top Products to see whether the same products account for revenue. A high-exit PDP that’s also a top-revenue product is the highest-leverage CRO target — that’s the page where shrinking exits has the largest dollar impact.
- The funnel surfaces which checkout step you’re losing them at. The 4-stage funnel —
wc_product_view → wc_add_to_cart → wc_checkout_start → wc_purchase— reads server-side from WooCommerce and shows per-step conversion rate. You don’t have to infer “shipping or payment?” from a/checkoutexit count anymore.
The one-page-one-fix-one-month rhythm still drives which page to fix. The Revenue Report now drives how much the fix actually moved revenue (not just exits).
What to do next
- Install or open Statnive on WordPress.org if you haven’t.
- Open the Pages report. Sort by Exit Count, descending.
- Identify which of your top 3 exit pages is PDP, which is cart, which is checkout.
- Pick one. Pull Baymard’s checklist for that pattern (linked above). Pick the highest-evidence fix you can ship today.
- Ship it. Note the date. Come back in 30 days.
- Read the pillar on Privacy-First Analytics for WooCommerce CRO for the full 7-step weekly loop this fits into.
Sort by count, not rate. Fix one thing. Wait 30 days. That is the whole post.