Find Best WooCommerce Traffic Sources Without GA4
How to rank your WooCommerce traffic sources by quality — not vanity — using a cookieless analytics plugin instead of GA4. The 8-channel grouping, the Scale/Fix/Maintain/Cut decision matrix, and why Klaviyo says $86K and Woo says $24K.
The most painful WooCommerce moment is not the abandoned cart. It is the message from a friend who runs paid ads asking: “Why does Facebook say I have 15 sales today when my Woo dashboard shows three?”
That gap is the most common reason a solo WooCommerce owner installs GA4 in the first place — and the most common reason they uninstall it three months later. GA4 was supposed to be the source of truth. Then it stopped seeing Safari users. Then the cookie banner ate half the data. Then ITP ate the 7-day window. Then iOS 17 broke the click IDs.
If you sell on WooCommerce as a solo owner, you do not need a sixth attribution model. You need to know which channels send qualified visitors and which channels waste money. This post walks the eight-channel grouping, the channel-health rule, the Scale / Fix / Maintain / Cut decision matrix, and the honest answer to “why is Klaviyo showing $86K when Woo only sees $24K?”
What this post answers
- How Statnive auto-groups your WooCommerce traffic into 8 channels (and why that beats GA4’s 24).
- The validated channel-health rule and the three caveats every solo owner gets wrong.
- The 4-action decision matrix (Scale / Fix / Maintain / Cut) for paid campaigns.
- Why Klaviyo and WooCommerce disagree on email revenue — and which one to trust.
- What the v1.0.0 WooCommerce Revenue Report adds to this channel-quality loop.
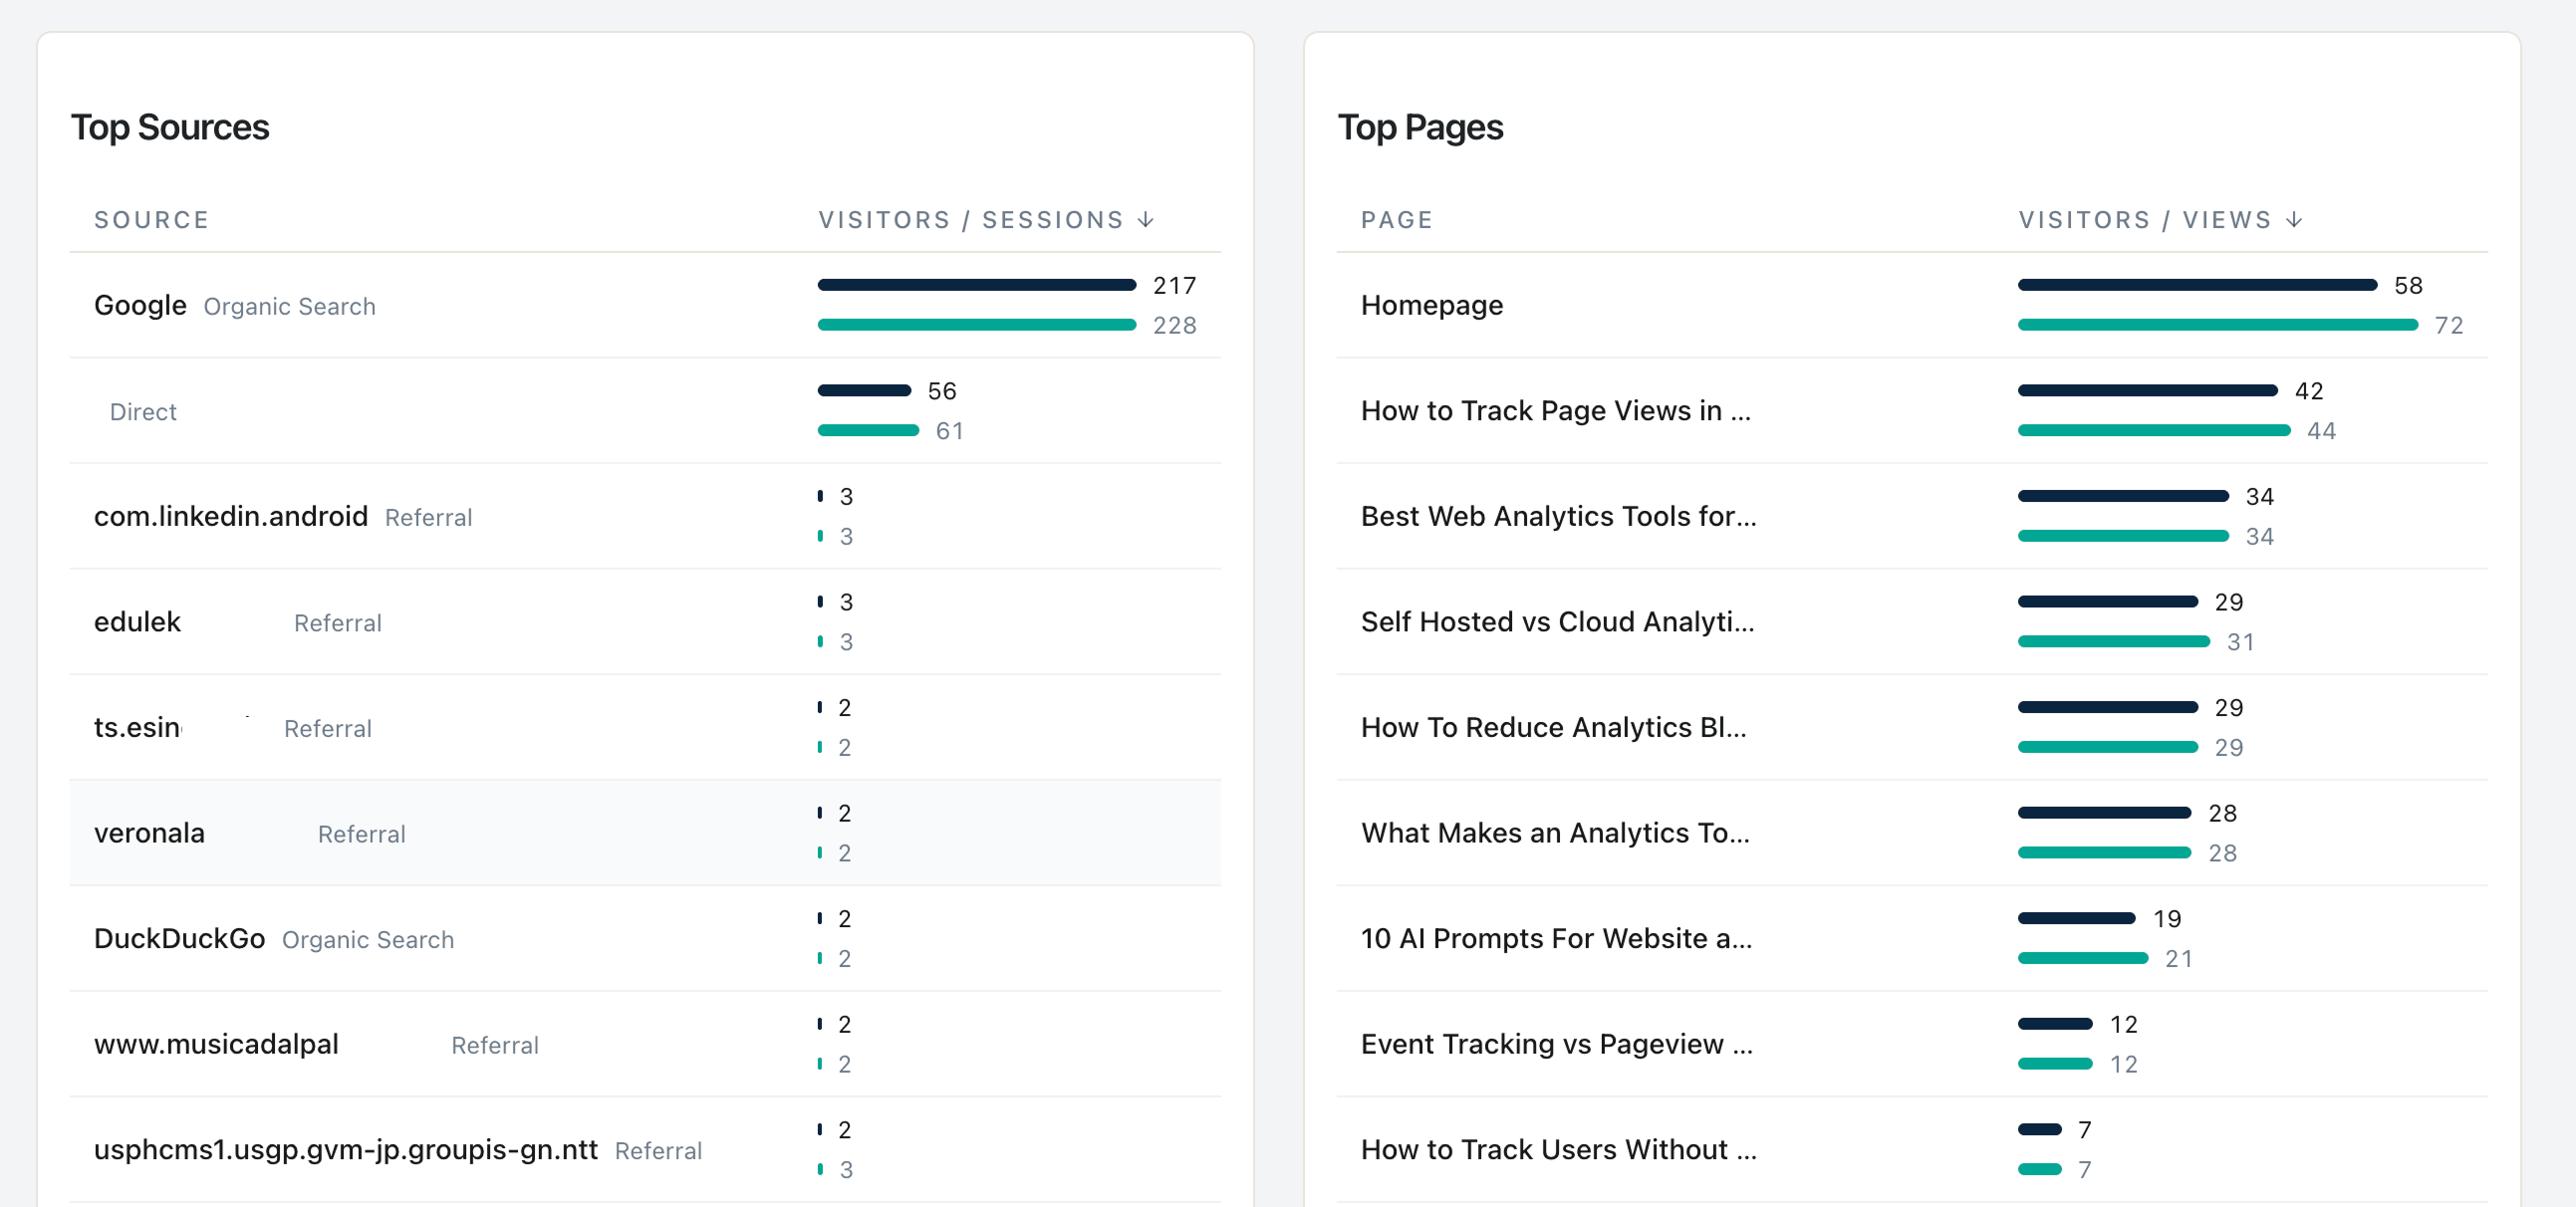
The 8 channels Statnive groups for you
GA4’s default channel grouping is now 24 categories. Statnive’s is 8, by design — eight is the number a solo owner can hold in working memory while scanning a weekly report.
| Channel | What lands here | GA4 equivalent |
|---|---|---|
| Direct | No referrer + no UTM | Direct |
| AI Assistants | ChatGPT, Claude, Gemini, Perplexity, Copilot, You.com (15 hosts) | Splits between Direct + Organic |
| Organic Search | Google, Bing, DuckDuckGo, Yandex, Baidu, Brave (27 hosts) | Organic Search |
| Social Media | Facebook, Instagram, TikTok, X, LinkedIn, Reddit, Pinterest, plus shorteners (35 hosts) | Organic Social |
UTM medium contains email OR referrer is a webmail host | ||
| Referral | Any other off-site referrer | Referral |
| Paid Search | UTM medium matches `^(.cp. | ppc |
| Paid Social | Same regex AND source is a social network | Paid Social |
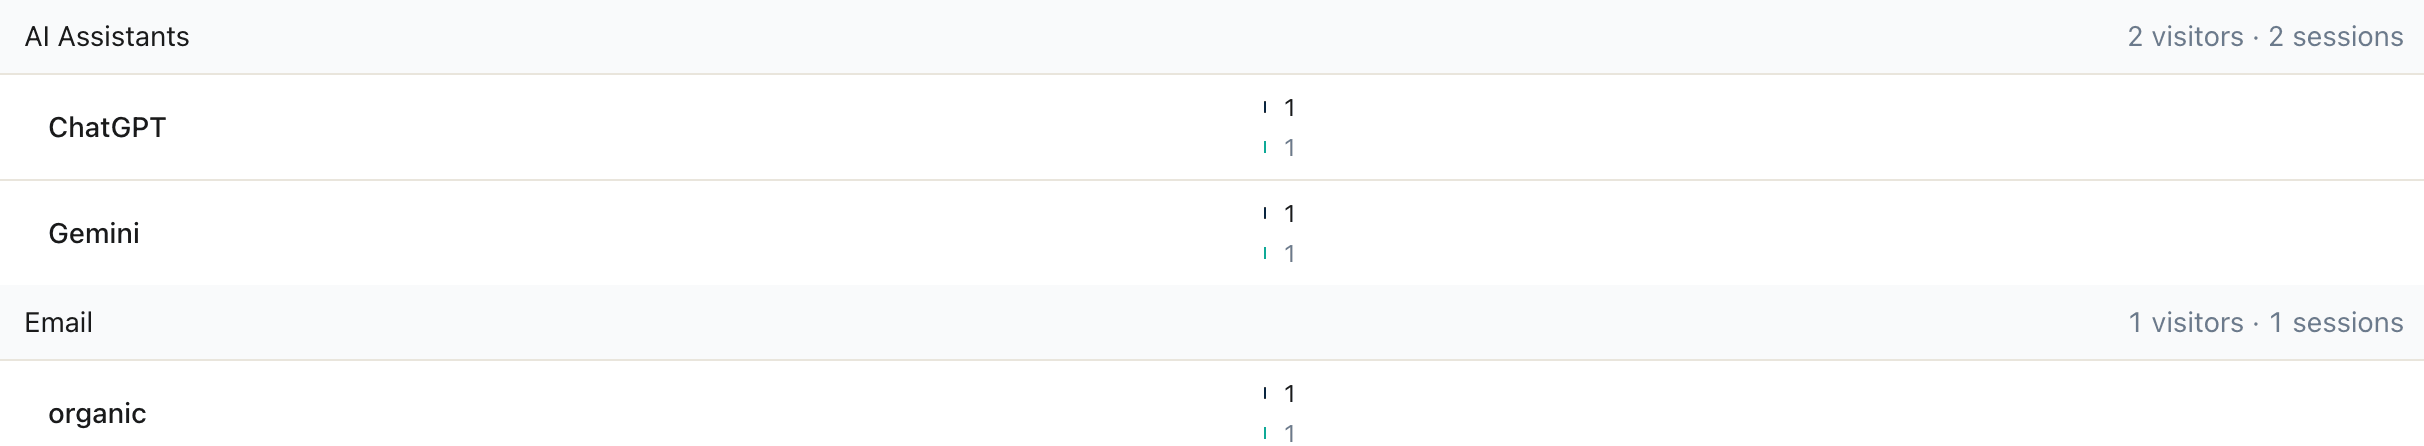
The AI Assistants bucket is the one nobody else has built into a default report yet. GA4 still routes gemini.google.com to Organic Search and chatgpt.com to Direct. For a Woo store, that is the difference between knowing AI search is a real channel and assuming your traffic dipped.
The channel-health rule (with three caveats nobody mentions)
The decision rule, in one sentence: a channel is healthy if its bounces are at or below the site average AND its session duration is at or above the site average, with at least 50 sessions in a 7-day window.
That is correct. But every CRO blog stops there and gets you in trouble. The three caveats:
Caveat 1 — Compare against an intent-matched cohort, not the site-wide average
A blog post that satisfies a search query bounces at 70–90% and the visitor leaves happy. A paid landing page that bounces at 60% is on fire. Per Siege Media’s analysis of 1.3 billion sessions, the healthy range for “informational content visits” is 65–90%; the healthy range for “transactional landing pages” is 25–45%. A site-wide average is the mean of those two distributions and is therefore wrong for both.
Fix: apply the rule within a single intent cohort. Compare each paid landing page’s bounce to the median of other paid landing pages — not to the blog. Compare each blog post’s bounce to other blog posts.
Caveat 2 — Require ≥50 sessions in a 7-day window before firing the rule
With fewer than 50 sessions, the bounce rate is statistical noise. Per CXL’s testing methodology guidance, you want at minimum hundreds of sessions before drawing channel-level conclusions. Fifty is the floor where you can spot directional problems; treat anything below as “not enough signal yet, keep watching.”
Caveat 3 — Frame the rule as “first to diagnose” not “first to pause”
The trap is to pause campaigns the moment they fail the rule. The right call is to diagnose first. A channel that fails both halves of the rule usually has one of four fixable issues:
- Wrong landing page. The ad sends to
/shop, the message was about a specific product. - Wrong audience. The Lookalike Audience drifted. The Custom Audience is exhausted.
- Broken UTM. The campaign manager rebuilt the link and dropped
utm_medium. Now it’s in Direct. - Real product-market mismatch. The cohort actually does not want what the ad promised.
Pause only after the diagnostic returns clean for two windows in a row.
The 4-action decision matrix: Scale / Fix / Maintain / Cut
Take each of your eight channels and answer two questions about each:
- Volume trend (last 28 days): rising, flat, or falling?
- Quality (the channel-health rule above): passing both halves, passing one, or failing both?
That gives you a 3×3 grid. Collapse it into four actions:
| Trend × Quality | Action |
|---|---|
| Rising + Passing | Scale — increase budget 20–25%, recheck in 7 days |
| Rising + Failing one half | Fix — diagnose which half, A/B test the landing page or the ad creative |
| Flat + Passing | Maintain — leave it; do not over-optimize a working channel |
| Falling + Failing | Cut — pause after 2-window diagnostic, reallocate budget |
This is the matrix to print and tape to your monitor. It collapses GA4’s 30-tab attribution dashboard into one decision per channel per week.
Why Klaviyo says $86K and Woo says $24K
If you run email through Klaviyo, you will see this. The Klaviyo dashboard claims $86K of “Klaviyo-attributed revenue” last month. Your Woo Reports → Orders shows $24K of total revenue. What is going on?
Two compounding effects:
- Klaviyo uses a 5-day post-click attribution window. Any order placed within 5 days of any email click — including a click from the welcome flow last week — gets attributed to the most recent email. Your Woo dashboard records the same order once, with whatever its actual last-click source was (often a Google search for the brand name after the email reminded them).
- Apple Mail Privacy Protection pre-fetches every email. That counts as an “open” in Klaviyo even when the recipient never opened your message. The downstream chain of “opened → clicked → bought” gets inflated 2–4× when the open data is fake.
Both effects make Klaviyo look 2–4× better than Woo’s source of truth — and neither side is lying. Klaviyo is correctly reporting “this order happened within 5 days of someone touching an email.” Woo is correctly reporting “this order’s last click was from the brand search after the email.” They are answering different questions.
The honest reconciliation for a solo owner:
- For your revenue truth, use the Woo order log. Always. It is the only number tax authorities accept.
- For email program ROI, use Klaviyo’s number with the caveat: “this is the upper bound assuming our 5-day window catches the right last click.”
- For channel allocation decisions, use Statnive’s session-grain Referrers report — it shows you which channels send qualified visitors at all, before any attribution-window argument starts. The visit data is uncontaminated by Klaviyo’s window or by GA4’s cookie loss.
The enterprise answer is to deploy server-side Conversions API and stitch a BigQuery layer. The solo-Woo answer is: stop arguing about which platform is “right” and use each one for what it is honest about.
What WooCommerce Order Attribution + Statnive look like together
Since WooCommerce 8.5 (January 2024), every Woo order carries a _wc_order_attribution_* post meta — first-touch source, cookie-based, with a 7-day window cap on Safari (the Apple ITP limit). It is a useful first-touch revenue lens.
Statnive does not overlap with this. Statnive is session-grain (every visit, not just orders), cookieless (no Safari 7-day cap), and currently does not see revenue. The two together cover the picture:
- Statnive’s Referrers report answers: where is the 99% of my traffic that did not buy this week coming from?
- WooCommerce Order Attribution answers: of the 1% that did buy, what was the first-touch source per order?
Enable both. Read them on different days for different decisions. Order Attribution drives budget allocation when you have revenue data; Statnive drives the channel-quality decision for the much larger pool of visits that never converted.
What the v1.0.0 Revenue Report adds
As of v1.0.0 (May 2026), Statnive’s Revenue Report ships the two things this channel-quality loop alone could not cover:
- Revenue per channel inside Statnive. The Revenue Report’s “Revenue by Channel” table shows Orders, Revenue (net), and AOV across the same 8 channels described above — Direct, AI Assistants, Organic Search, Social Media, Email, Referral, Paid Search, Paid Social. You can answer “Paid Search drove $4,200 last week” without leaving Statnive.
- Cart-stage drop-off. The Cart-to-Purchase Funnel reads four server-side events from WooCommerce —
wc_product_view → wc_add_to_cart → wc_checkout_start → wc_purchase— and shows per-step conversion rate. You can see where Paid Social drops between cart and checkout, not just that they exit somewhere after the cart page.
Both shipped free, on WordPress.org, in v1.0.0. Historical orders backfill automatically the first time you open the Revenue Report — no setup required.
The channel-quality loop in this post still drives the traffic side of the decision (which channels deserve more ad spend), and now composes with the Revenue Report for the purchase side (which channels actually convert and at what AOV). Run both side by side: a channel can fail the bounce+duration rule but still convert well, or pass the rule and convert badly. Either way, you now have the data.
What to do next
- Install Statnive on WordPress.org if you have not yet.
- Open the Referrers report. Identify your eight channels’ 7-day session counts.
- For each channel with ≥50 sessions, compute its bounce and duration vs. its intent-matched cohort.
- Place each channel on the 3×3 Trend × Quality grid; collapse to Scale / Fix / Maintain / Cut.
- Run the diagnostic on the “Cut” candidates for two more windows before pausing.
- Read the pillar on Privacy-First Analytics for WooCommerce CRO for the full weekly loop this fits into.
That is the workflow. Ten minutes a week. No GA4. No Looker. No “DTC e-commerce growth stack.” Just your store, eight channels, one matrix, and the discipline to diagnose before you pause.