Which Countries Are Worth Localizing For (WooCommerce)
Use Statnive's Geography + Languages reports to identify localization candidates honestly. The 5%/80% threshold, the currency-vs-language sequence, and the hidden costs nobody mentions when they tell you to translate everything.
Three real solo WooCommerce owners, three real situations:
“22% of my traffic from Germany but cart conversion is half of the UK. Should I translate or is something else going on first?”
“Getting consistent orders from France for 3 months but site is English-only. Is WPML the move or just a currency switcher?”
“Localized Italian on a hunch — 200 SKUs, $1,200 cost, $25,000 in one weekend. German last year did almost nothing. Wish I’d had a way to know which one would land.”
The localization decision is high-leverage and high-risk. The right call lifts conversions meaningfully on a specific market; the wrong call burns weeks of translation work for no measurable return. The data that should drive the decision is sitting in your Statnive Geography + Languages reports today — for free, with no extra setup.
This post is the decision rule. The 5%/80% threshold. The currency-first sequence. The hidden costs nobody else mentions.
What this post answers
- The 5%/80% threshold that tells you which countries are localization candidates.
- The currency-vs-language sequence: which to test first and why.
- The 3 multi-currency plugin paths (with FX-fee math).
- The four hidden costs the “translate everything” listicles never mention.
- The Browser-Language signal you’ve been ignoring in Statnive’s Languages report.
The 5%/80% threshold
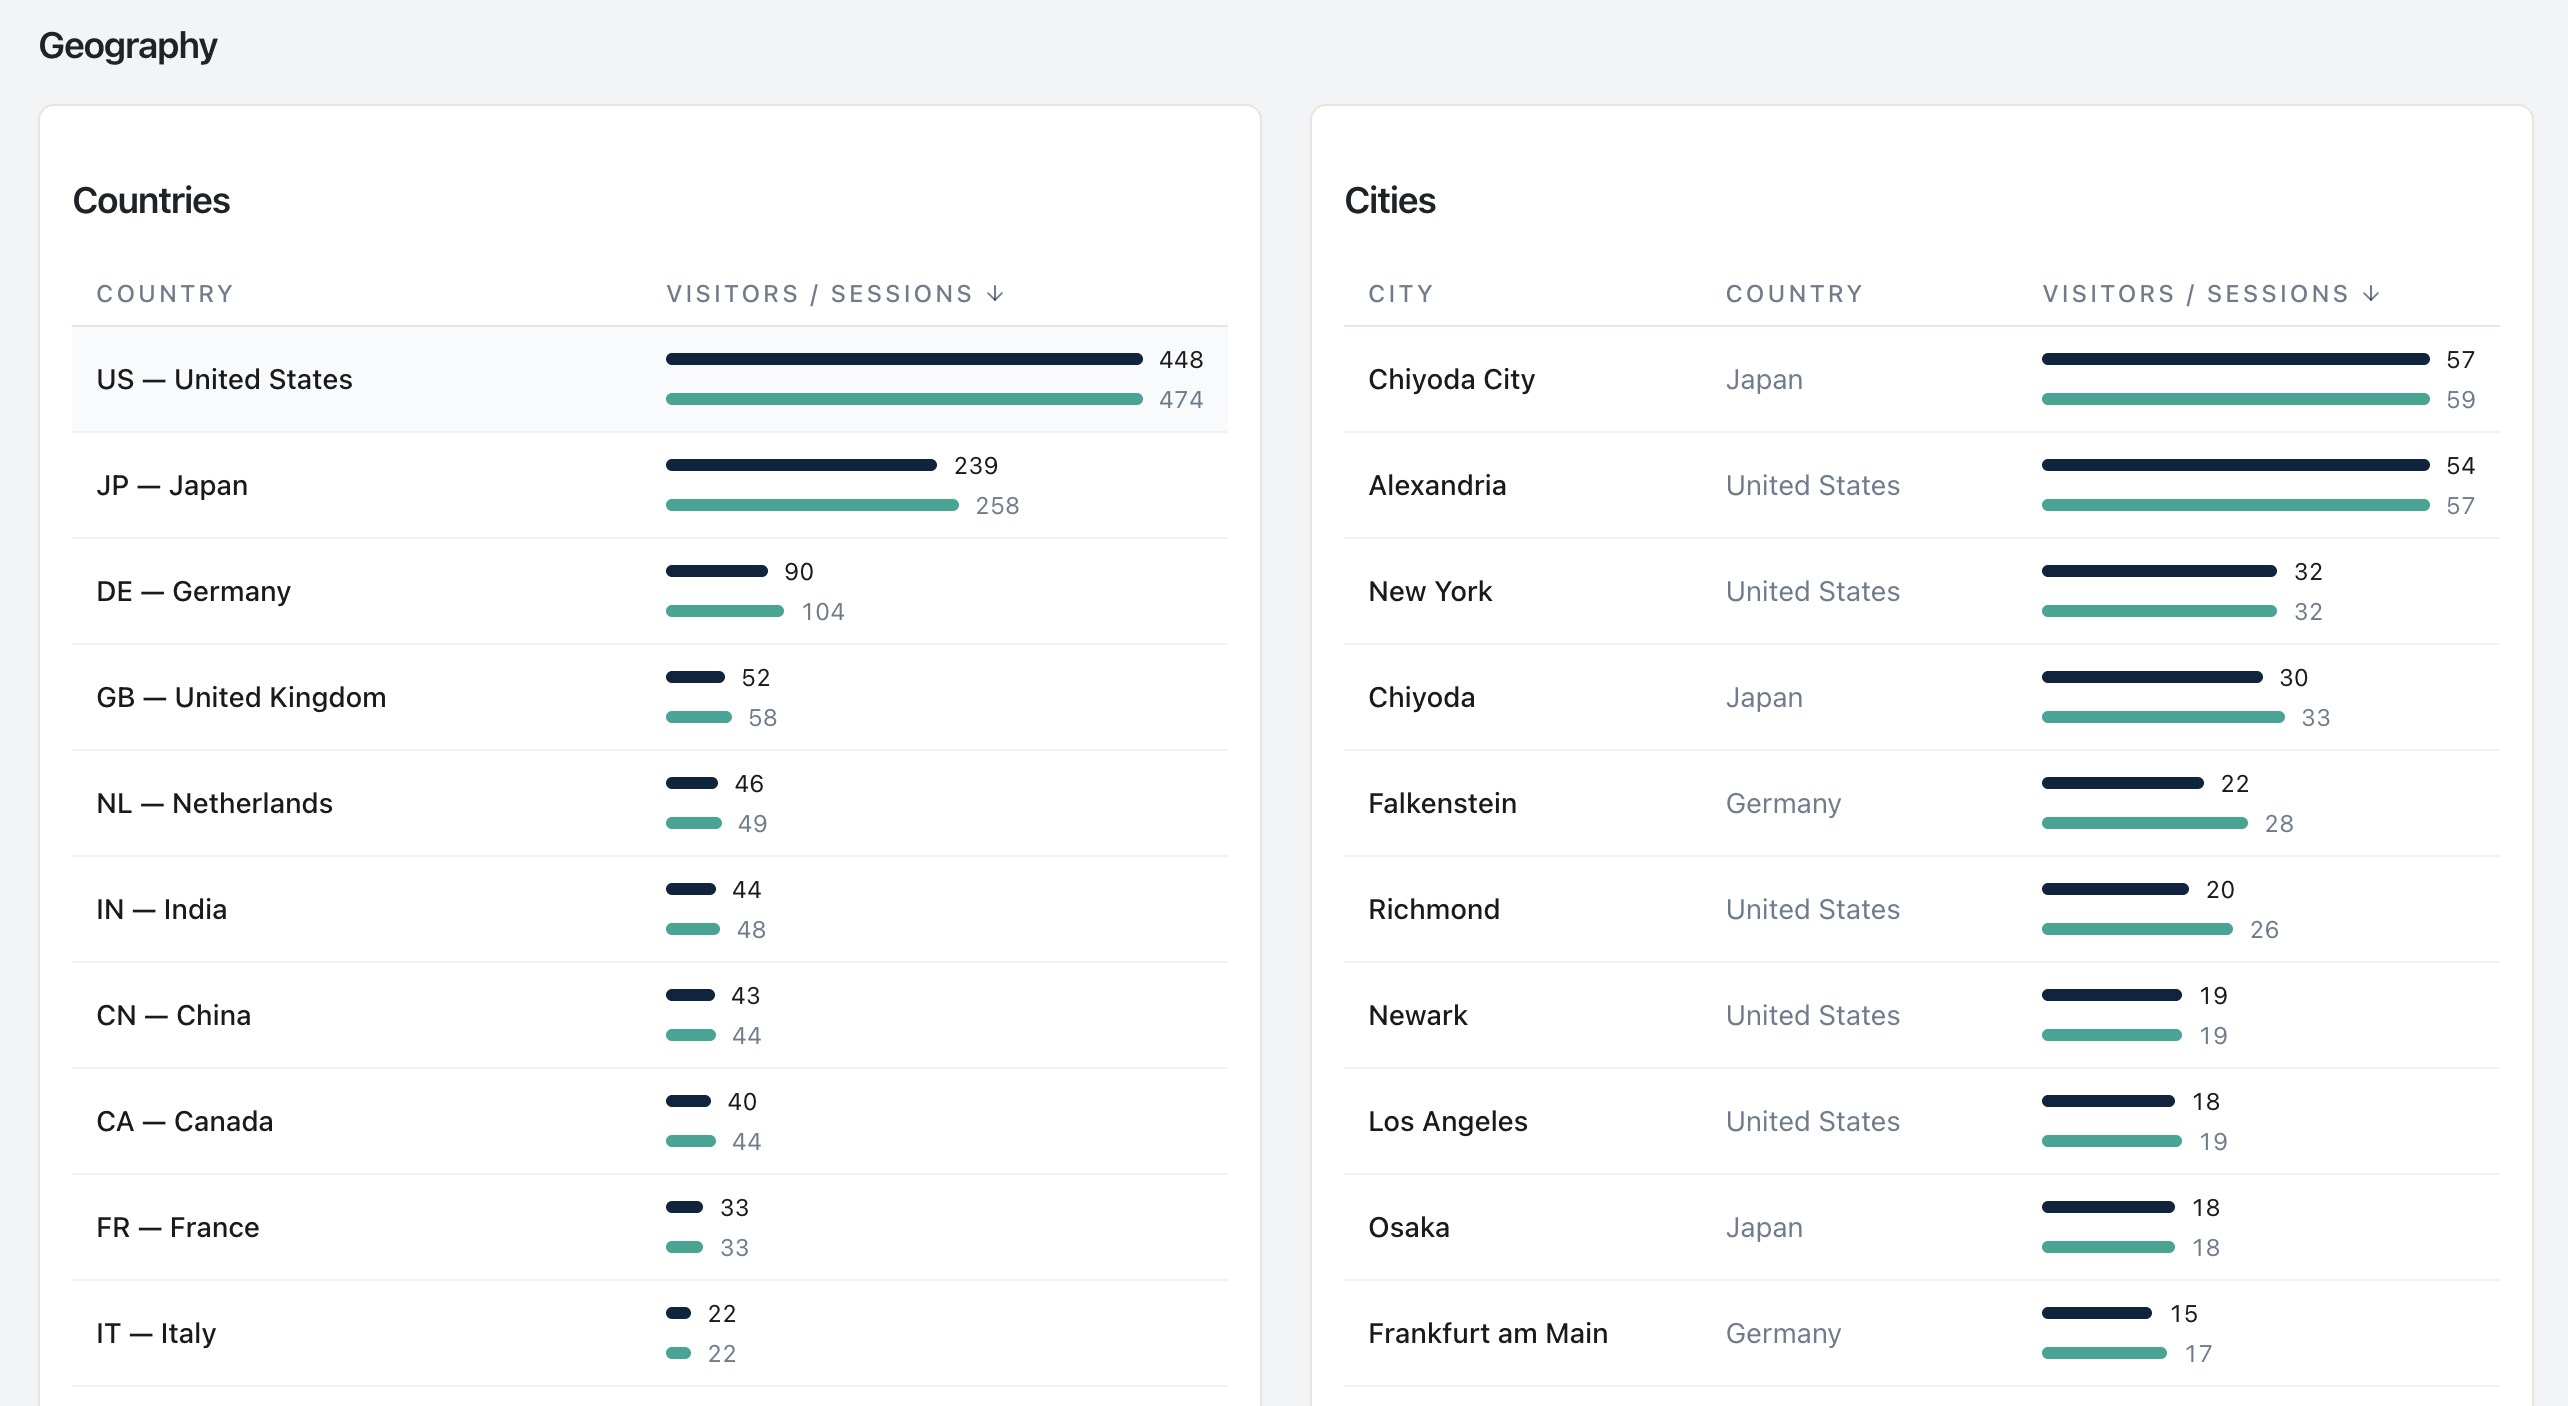
Open Statnive → Geography report. Filter to the last 90 days. Sort by Visitors descending. For each non-domestic country in your top 10:
Two conditions, both required:
- ≥5% of total sessions. Below 5%, the test population is too small to read reliably in a 30-day localization test.
- Average duration ≥80% of your domestic-visitors’ duration. Below 80%, the visitors are signaling something else is wrong — wrong product-market fit for that country, wrong traffic source, broken landing page — that localization won’t fix.
If a country meets both, it’s a candidate. The next decision is currency-first or language-first.
Real example reading:
| Country | Visitors share | Duration vs domestic | Candidate? |
|---|---|---|---|
| United Kingdom (home) | 45% | 100% baseline | — |
| Germany | 22% | 92% | Yes — strong |
| Netherlands | 8% | 78% | Borderline — investigate why duration is short |
| Italy | 6% | 89% | Yes |
| France | 4% | 85% | Below 5% threshold — watch, don’t commit |
| United States | 7% | 45% | Wrong-audience signal, not a localization opportunity |
The US row is the trap. High traffic share, but duration is half of domestic — these visitors are bouncing because they’re either the wrong audience entirely or because your shipping rates make the product non-viable for them. Adding a US English landing page won’t fix either.
Currency first, language second
The cheapest meaningful test is currency display, not translation. Three reasons:
- Cost. Currency display takes 30 minutes via CURCY (free) or WooCommerce Payments’ native multi-currency. Translation requires a plugin (WPML $99-199/yr, Polylang Pro $99/yr), a translator (or AI + native review), and recurring maintenance.
- Reversibility. If currency display doesn’t lift conversions, you uninstall the plugin and you’re back where you started. A bad translation lives on your store until you remove every string.
- Diagnostic clarity. If currency display alone produces a measurable lift (5-15% on visitors from the targeted country), that’s signal of pricing-perception drag, not language drag. You learn which intervention to commit to next.
The honest sequence:
| Test | Cost | Time to ship | Expected lift | When to escalate |
|---|---|---|---|---|
| Currency display only | $0 (CURCY free) | 30 min | 5–15% on country | If ≥5% lift after 30 days |
| Currency display + local payment methods | ~2% FX | 1 day | 10–20% on country | If ≥10% lift |
| Full translation (UI + content) | $300–$1,500 | 1–2 weeks | 15–30% on country | When the above prove demand |
| Country-specific landing pages | $500+ | 3–4 weeks | 20–40% on country | When sustained 6mo+ traffic |
POWR’s widely-cited “92% prefer local currency / up to 40% conversion lift” figure is the industry ceiling, not the median. Honest median for currency-only display is single-digit to low-double-digit percentage. The 40% number usually requires currency + language + local payment + DDP shipping combined — and you should expect to ladder there, not jump.
The 3 multi-currency plugin paths
For currency display, three options worth knowing:
Path 1 — CURCY (Free, currency display only)
The most-installed free multi-currency plugin for WooCommerce. Shows visitors prices in their local currency based on browser locale or manual switcher. Checkout still completes in your store’s base currency.
Watch out for: the visitor sees €19.99, completes checkout, and gets charged $22.45 USD. A consent banner at the price-display step is essential (“Prices shown in EUR; charged in USD at checkout”) or you’ll see surprise-FX cart abandonment.
Path 2 — WooCommerce Payments native multi-currency (~2% FX)
If you use WooCommerce Payments as your gateway, multi-currency is built-in: visitors see and pay in their local currency, automatic FX conversion at ~2% margin. Cleanest UX. Limited to the 130+ currencies WooPayments supports.
Watch out for: WooCommerce Payments isn’t available everywhere (US, UK, EU, AU, NZ, CA, JP, others as of 2026). Check eligibility before committing.
Path 3 — Stripe Adaptive Pricing (2-4% FX)
Stripe’s solution for showing local-currency prices and charging the same way. 2-4% FX margin depending on currency pair. Works internationally.
Watch out for: Stripe Adaptive Pricing requires enabling at the Stripe account level, and the configuration is gateway-specific. Read Stripe’s official documentation before going live.
If your gross margin is below 25%, charging in local currency may erase your profit. In that case, stick with currency display only — visitor sees local prices for context, but pays in your base currency at checkout.
The four hidden costs of going international
The “translate everything!” listicles never mention these. Plan for them before committing:
Hidden cost 1 — Shipping zones + carrier negotiation
Adding a country means configuring a WooCommerce shipping zone for it. That means: pricing tiers, weight brackets, carrier integrations, customs forms. See Post 10 on geography-driven shipping decisions for the operational side.
Hidden cost 2 — Tax registrations
- UK: £85,000 turnover threshold for VAT registration (£90,000 from April 2024).
- EU: OSS (One-Stop Shop) scheme triggers when cross-border B2C sales to EU consumers exceed €10,000/year combined. Below that, you charge your home country’s VAT.
- US: Per-state nexus rules — once you exceed a state’s economic-nexus threshold (often $100K revenue or 200 transactions), you must register and collect sales tax there.
These aren’t optional. Tax compliance is the silent killer of small international ecommerce.
Hidden cost 3 — Multilingual customer support
Lokalise’s multilingual-support research shows multilingual support tickets take 30-45 minutes vs. 5-10 minutes for native-language. 82% of small ecommerce stores don’t offer multilingual support — they translate their store and then can’t actually serve customers who write in.
Plan for AI-assisted translation in your help-desk tool (Help Scout, Crisp, Intercom all integrate with DeepL or similar) or accept that you’ll get refund requests instead of resolved tickets.
Hidden cost 4 — Translation regression
Every WordPress theme update, every WooCommerce plugin update, every plugin you add can introduce new strings that aren’t translated. The translated experience degrades silently until you re-translate. Budget for a quarterly translation audit — at minimum, run your store through a localized browser and look for English fallback strings.
The Browser-Language signal in Statnive’s Languages report
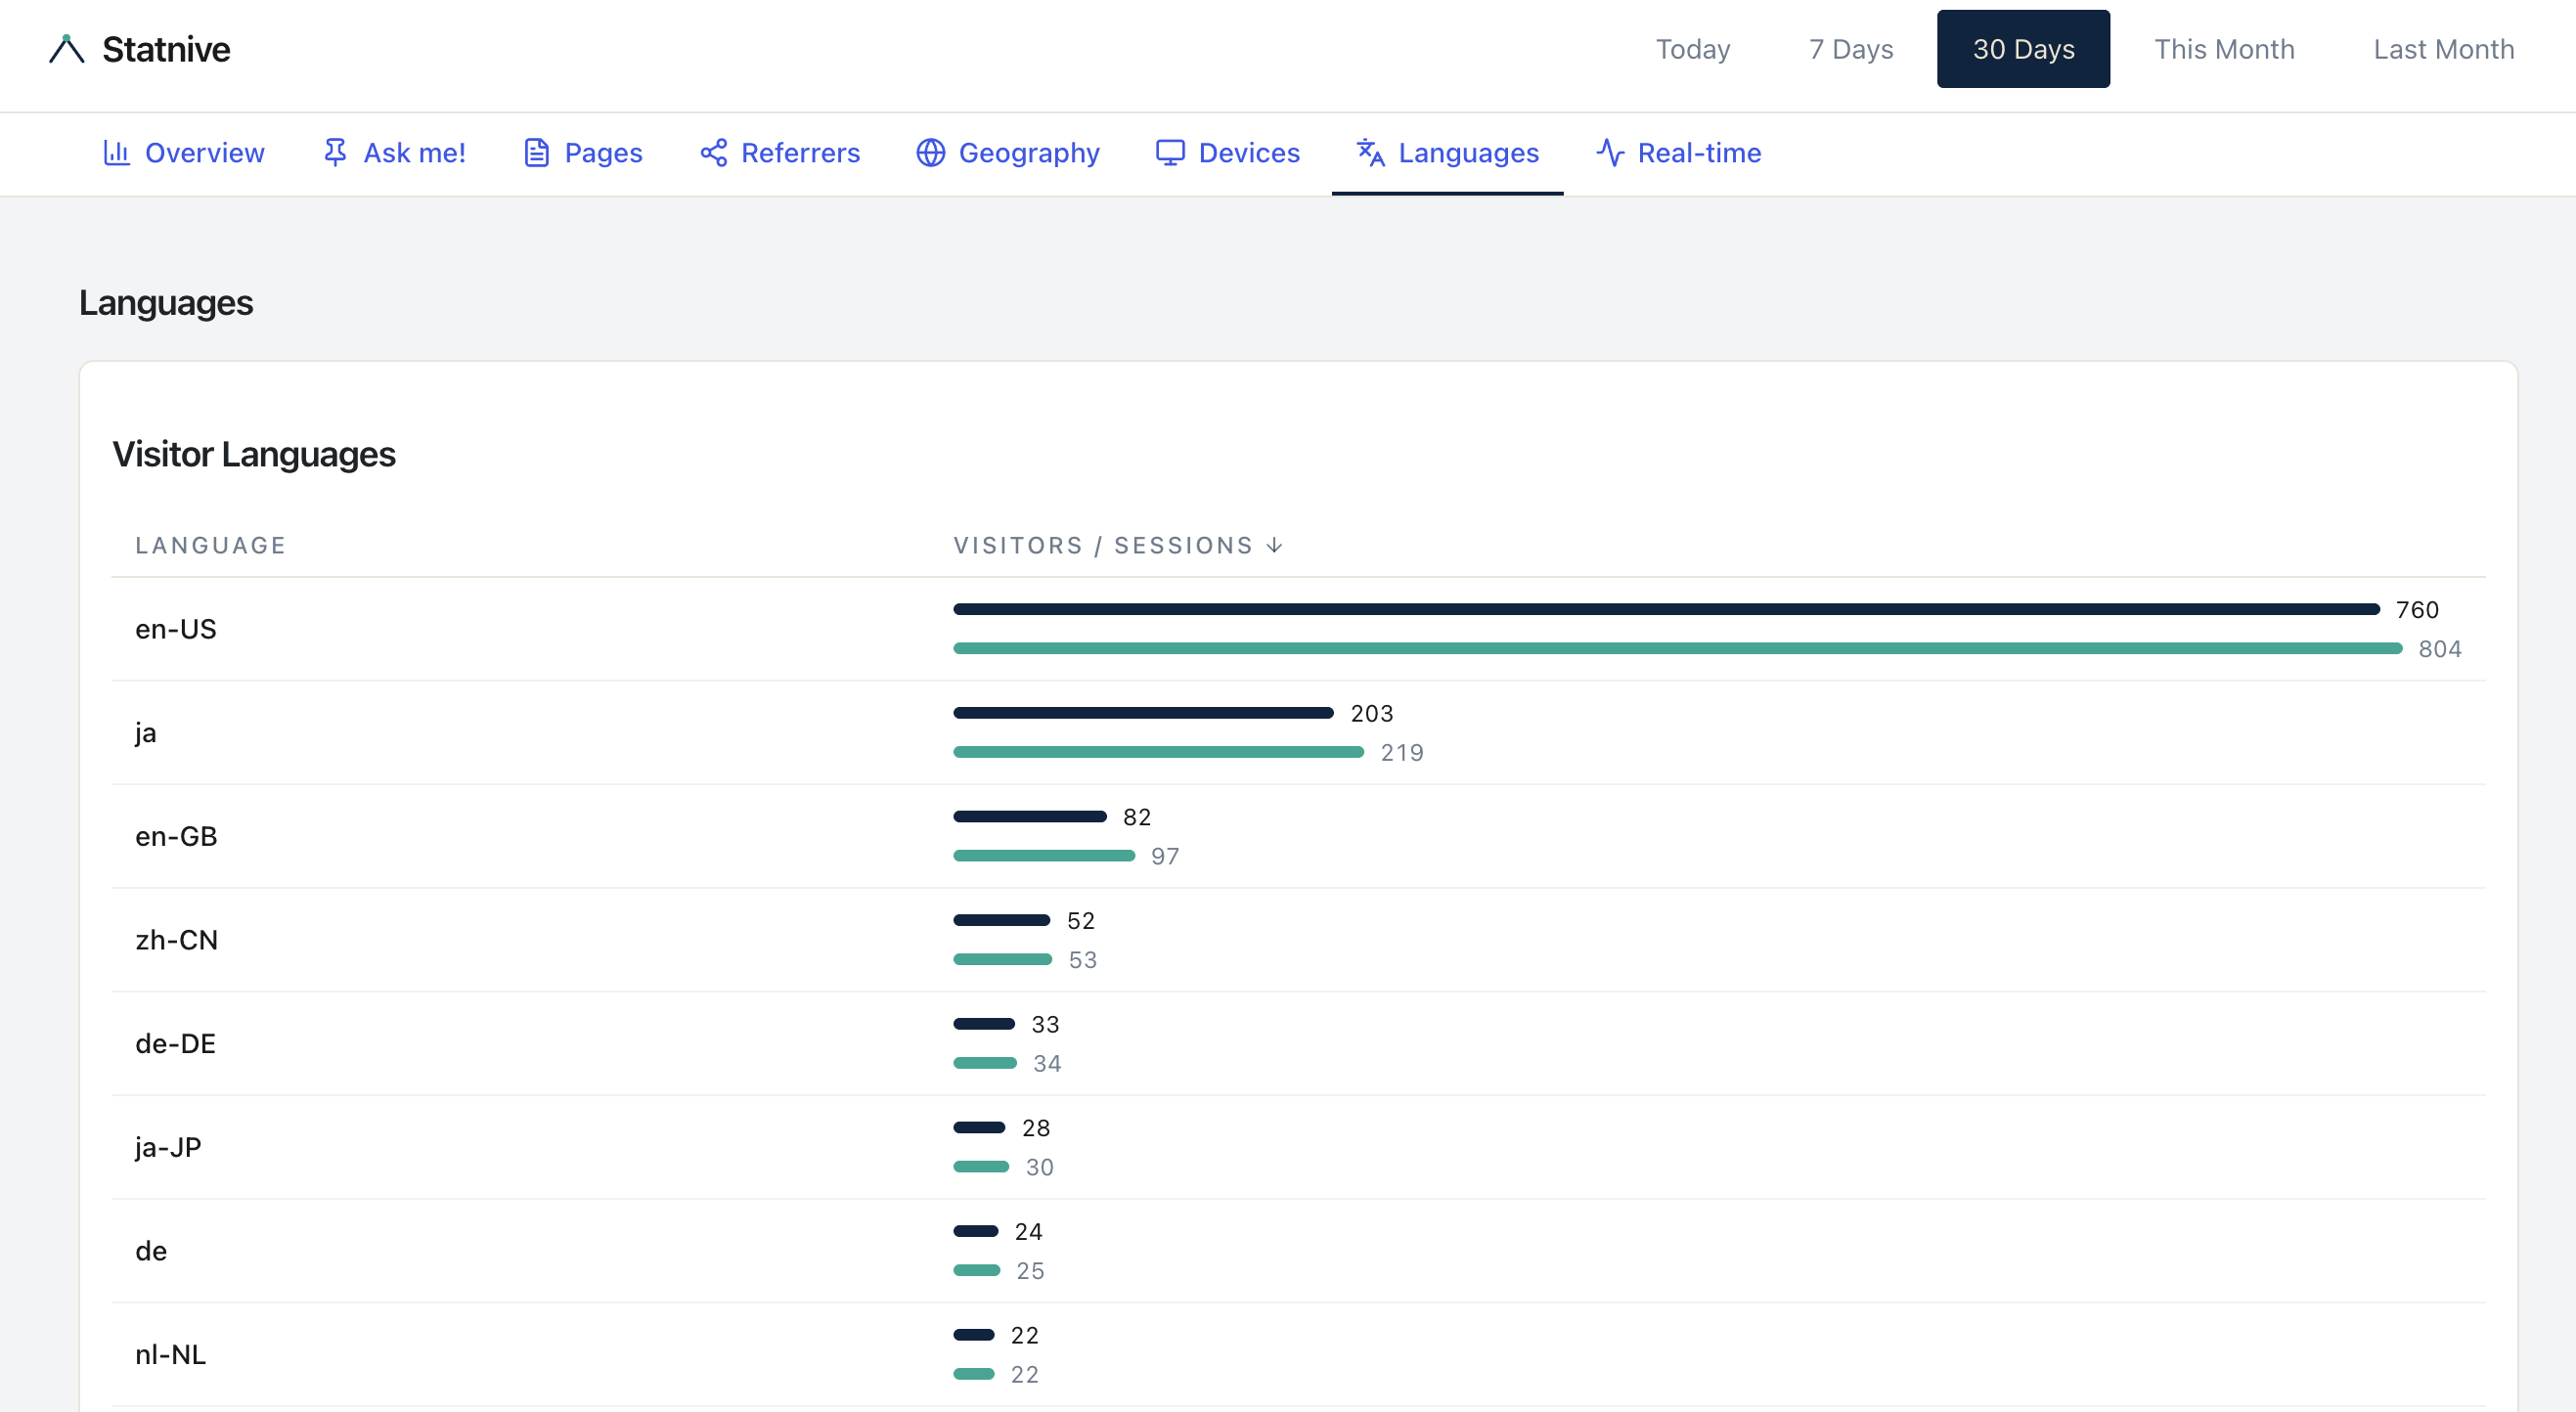
Statnive captures the visitor’s browser language (Accept-Language header) in the Languages report. This is a different signal from Geography — and you should cross-reference both.
Why it matters: a visitor from Germany whose browser language is set to English is probably an expat or international tourist who reads your English content fine. A visitor from Germany whose browser language is de is signaling that they’d prefer German.
The cross-reference rule: if a country shows ≥5% session share AND ≥30% of that country’s visitors have a non-English browser language, language translation is likely to lift conversions more than currency display alone. If browser languages from that country are mostly English, currency-display-only is the right test.
The 30-day localization test plan
If a country passes the 5%/80% threshold and you’ve decided to test:
- Day 0: install CURCY (or WooCommerce Payments multi-currency). Note your last-30-days baseline: visitors from country X, orders from country X, AOV from country X.
- Day 1–30: measure. No other changes to your store during the test window (or you can’t attribute the result).
- Day 30: compute the lift. (Country X orders post-install ÷ Country X orders pre-install). If ≥5%, commit further (language). If below 5%, currency wasn’t the bottleneck — investigate the duration-vs-domestic gap for other causes.
- Day 30–90 (if step 3 passed): scope language translation. Identify pages with the highest country-X traffic and translate those first (PDPs and the home page typically). Don’t translate the blog yet.
- Day 90+: evaluate fully. Sustained lift = commit. Single-month bump = revert.
Two known limits
As of v1.0.0, Statnive’s Revenue Report breaks revenue down by Channel, Top Products, and Cart-to-Purchase Funnel — but not by country. Two limits remain on the localization workflow above, framed honestly:
- Per-country revenue per visitor inside Statnive. For per-country revenue, cross-reference Geography (Statnive) with Orders by country (WooCommerce admin). A per-country dimension on the Revenue Report is not in v1.0.0.
- Localization-test conversion-rate measurement. You still compute the localization-test lift manually with two date-range queries in WooCommerce admin → Reports, comparing the targeted country’s orders before and after the test. The Revenue Report’s overall KPIs give you the global before/after, but not the per-country split.
What to do next
- Open Statnive Geography for the last 90 days. Identify your top 5 non-domestic countries.
- Apply the 5%/80% threshold. Note the candidates.
- For each candidate, install currency display first (CURCY free is enough for the test). Run 30 days. Measure.
- For passing candidates, scope translation per the sequence above.
- For everything else, see the full CRO playbook for the broader operating loop.
The countries that deserve your time will reveal themselves to the threshold. The ones that don’t, save your translation budget — your competition is wasting theirs on the wrong markets.