Analyze WooCommerce Product Pages Without Complex Dashboards
Three questions you can answer about your WooCommerce product pages today using only Statnive's Pages report and the free native WooCommerce Analytics → Products report — no GA4, no heatmaps, no $99/mo dashboard tools. Plus the two questions you can't answer yet (and what unlocks them).
You open WooCommerce. Reports → Products. You see 100 products and one number per product: items sold. You can’t see views, you can’t see why some products attract attention and never sell, and you can’t tell which products would be best to promote because there’s no funnel.
You open Google Analytics 4. You see a “wall of charts that doesn’t tell you what to do” (verbatim from a real WordPress store-owner forum post). You click “Engagement → Pages and Screens”, filter to /product/, can’t find AVG Time on Page, give up.
You install Hotjar. You’re a “non-technical person” (also verbatim, from a 2-year Clarity user). You open one recording. You close the tab.
That is the actual workflow most solo WooCommerce owners are in today. This post is the antidote: three questions you can answer about your product pages using only Statnive’s Pages report and WooCommerce’s free Analytics → Products report. No GA4. No heatmaps. No $99/mo dashboard tool. One question at a time, under ten minutes total.
What this post answers
- The three product-page questions you can answer today with pageview + order data alone.
- What the v1.0.0 Revenue Report adds to this workflow (Top Products + 4-stage Cart-to-Purchase Funnel).
- The four common product-page CRO anti-patterns the SERP keeps repeating.
- Why the most-viewed product ≠ the best-selling product (and why both matter).
The three answerable questions
Q1 — Which products attract the most attention?
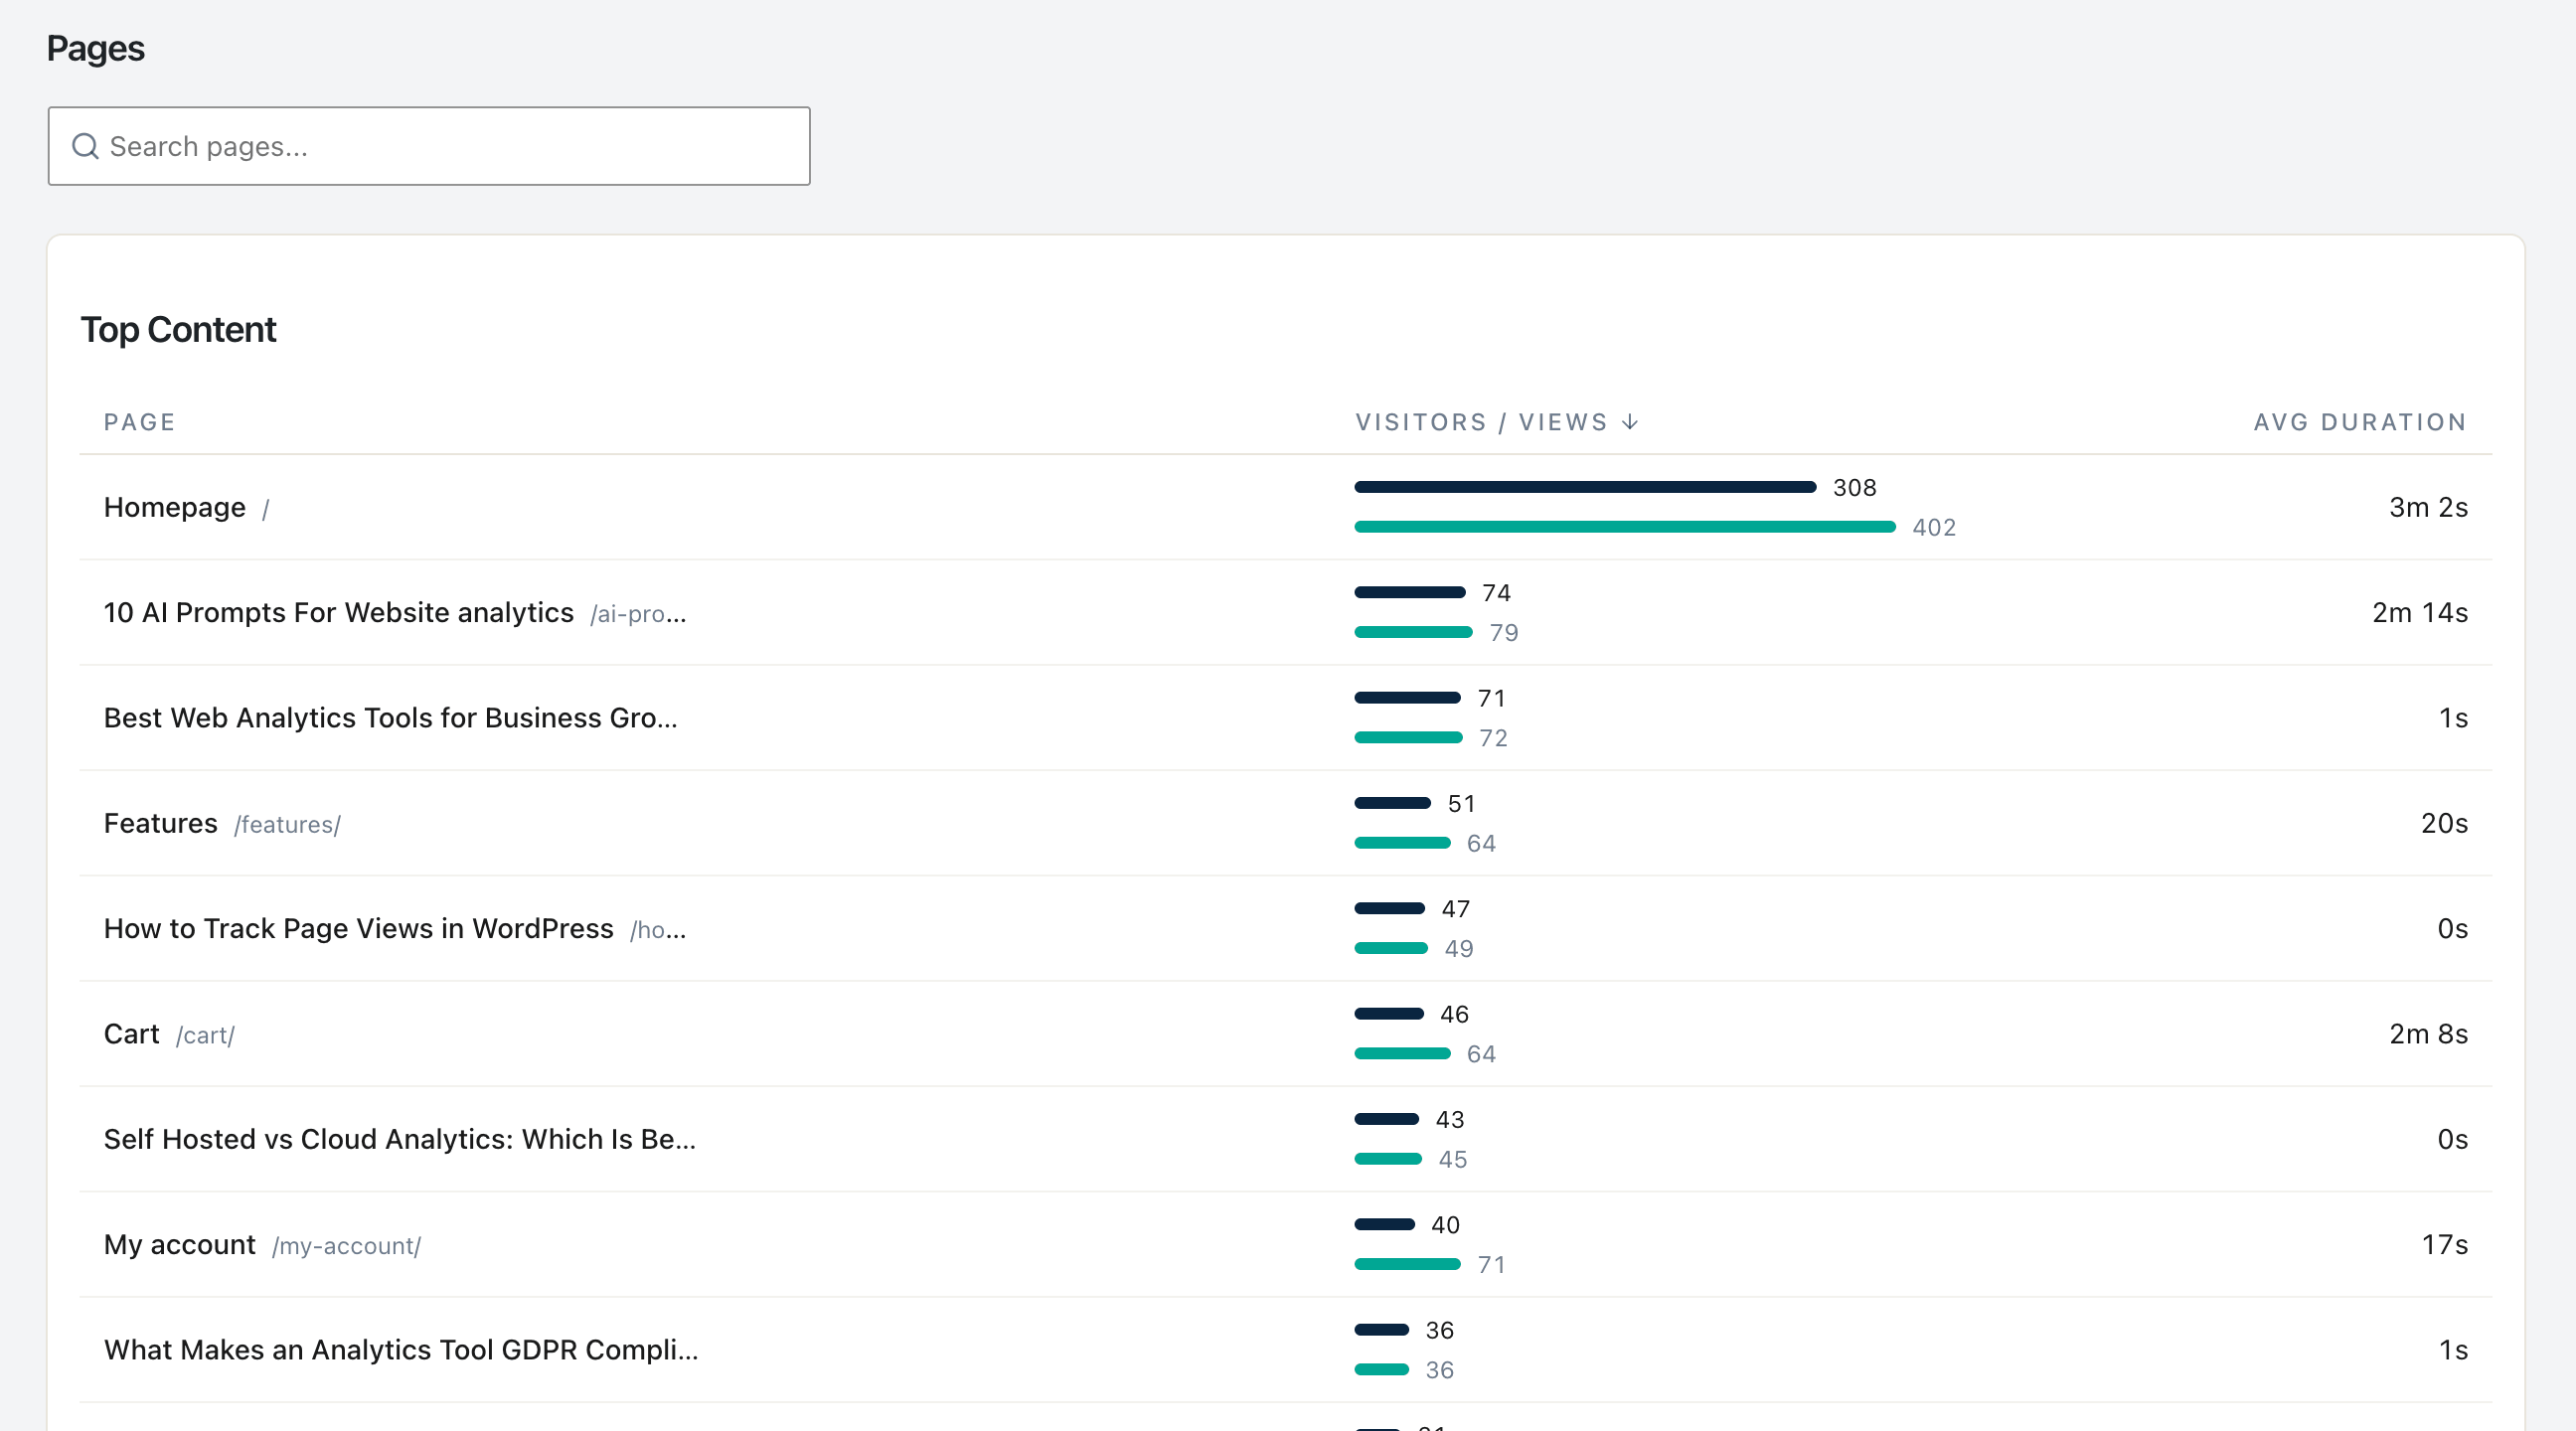
Where: Statnive → Pages → search /product/ → sort by Views descending.
What you do:
- Type
/product/into the Pages report search box. - Sort by Views (visitors who landed on a product page).
- Read the top 10. That’s your attention ranking.
What you learn: which products are doing the marketing work for you — whether through Google search, social, email, or word of mouth. Per Smile.io’s analysis of 100,000+ stores, about 20% of products generate 80% of traffic on a typical store. The Pareto distribution is real and stable.
Caveat: the search box is a client-side substring match against the top 20–100 rows returned by the API (sorted by visitors). If you have hundreds of products in the long tail, those won’t appear in the filter result. For most solo stores this is fine — your top products are in the top slice. If your catalog has 500+ products, ask WooCommerce Analytics → Products instead.
Q2 — Which products attract attention but DON’T convert?
Where: Cross-reference Statnive’s Pages views with WooCommerce Analytics → Products items-sold count.
What you do:
- From Statnive: top 10 products by Views (Q1).
- From WooCommerce → Analytics → Products: same date range, items sold per product.
- Build a 4-column table: product / views / items sold / conversion rate = items sold ÷ unique visitors.
- Sort by views descending. Note any product where conversion rate is below your overall site conversion.
What you learn: the “Attractive Failures” — products that pull visitors in but lose the sale. Per Nielsen Norman Group’s e-commerce research, the most common Attractive Failure pattern is: the product photo is great, but the PDP fails to answer one of three buyer questions (will it fit, when will it arrive, can I return it).
Real example math:
| Product | Views | Items sold | Conversion rate |
|---|---|---|---|
| Hero T-Shirt | 1,200 | 36 | 3.0% |
| Niche Mug | 200 | 16 | 8.0% |
| Failed Hoodie | 800 | 8 | 1.0% |
| Hat | 600 | 18 | 3.0% |
The Failed Hoodie is the priority. It pulls 800 visitors (40% more than the Niche Mug at 200) and converts a third as well as the Hero T-Shirt. Fix the Hoodie, not the Niche Mug, even though the Niche Mug has a “worse” view count in absolute terms.
This is the analysis nobody runs because nobody splits the question into views vs. sales. The data is right there in two free reports.
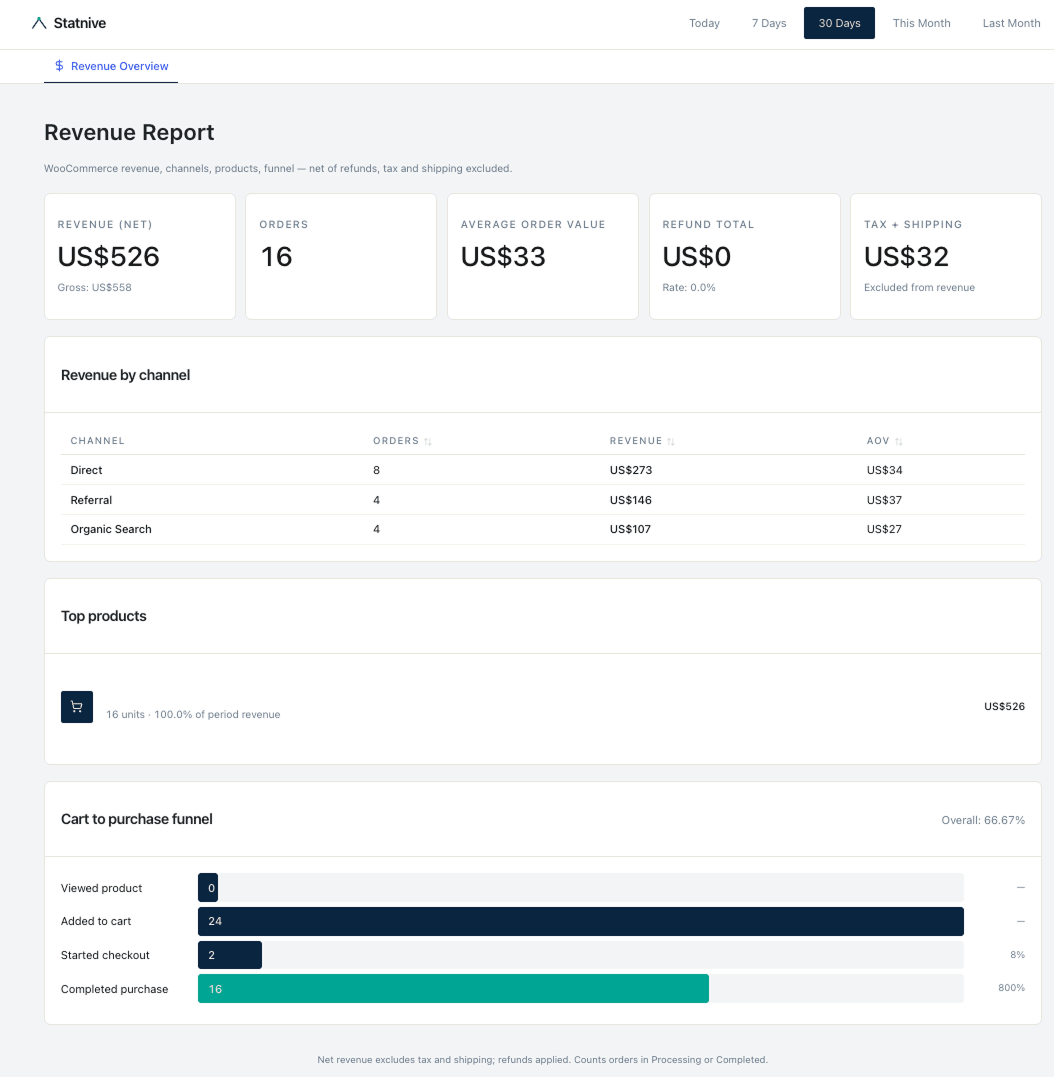
As of v1.0.0, Statnive’s Revenue Report → Top Products joins the two-report cross-reference into a single view — units, revenue, and refunds applied per product (grouped under parent for variable products) — so the Attractive Failures jump out without manually pivoting WooCommerce → Analytics → Products against your Pages report.
Q3 — Where do PDP visitors go next?
Where: Statnive → Pages → look at Exit Count vs. Views for the PDP.
What you do:
- For each PDP in your top 10, compute exit rate (
exit count ÷ views). - High views + high exit rate = visitor leaves from PDP (didn’t even add to cart).
- High views + low exit rate = visitor went somewhere else after the PDP (likely cart or another product).
What you learn: which PDPs are the dead-end vs. which PDPs are the gateway. Per Baymard’s three-bucket next-page model:
- Exit (lost): the PDP is the last thing they did on your site. Friction is on the PDP itself.
- Bounce to home/category: visitor exploring, not committed. Less urgent.
- Forward to cart: the PDP worked, problem (if any) is downstream.
Caveat: Without add_to_cart events you can’t tell exactly where they went. The proxy is the pillar on entry and exit pages — the absolute-loss math from that post applies here. Exit count is a count, not a rate, and sorting by count is your priority queue.
The two questions you CAN’T answer yet
Be honest about this in your weekly workflow — don’t pretend the data does something it doesn’t:
- Per-product add-to-cart rate. The
add_to_cartevent is the bridge between “they looked” and “they wanted it.” Without it, you cannot distinguish “this PDP is great and the cart is broken” from “this PDP is broken.” The events MVP closes this. - Per-product image-gallery interactions. Did they swipe through all 5 photos, or did they bail on photo 1? Did they zoom on the detail shot? These behavioral micro-events are what heatmaps were invented to surface — but on a solo store with 200 PDP-views/month, heatmaps generate noise, not signal. The events MVP will add a
product_gallery_viewevent for stores that exceed the volume threshold.
Until then: heuristic-first. Use Baymard’s PDP checklist (image quality, returns badge, delivery ETA, social proof, mobile thumb-zone CTA) as your hypothesis source for the Attractive Failures you found in Q2. One PDP, one fix, 30 days, measure before-vs-after on absolute orders.
Four anti-patterns to skip
Every “ecommerce product page optimization” listicle repeats these. The research debunks them.
- “Run a heatmap on every product page.” Hotjar’s and Microsoft Clarity’s own documentation acknowledges that meaningful heatmap signal requires roughly 1,000 sessions per page per month. Most solo Woo stores have ~50–500 sessions per PDP per month. The heatmap will show you cursor noise.
- “A/B test your product image.” As above, ~19 months per significant test at typical solo-store volumes. Use Baymard’s evidence-backed image guidelines as the heuristic; A/B testing is the wrong tool at this scale.
- “Optimize for Time on Page.” Per NN/g’s interpretation guide, high time on a product page can mean genuine interest or confusion — the metric is ambiguous in isolation. Always pair Avg Duration with Exit Count. A 4-minute average duration with a 70% exit rate is a confusion signal; a 4-minute average with a 25% exit rate is engagement.
- “Add cross-sells, upsells, related-products, recently-viewed.” Each of these widgets adds page weight and decision fatigue. Per Baymard, the highest-evidence PDP layout is: image gallery, title, price + shipping cost, primary CTA, trust signals, reviews, in that order — then nothing else above the fold. Cross-sells below the fold are fine; above-the-fold widgets reduce conversion.
Three more WooCommerce-specific gotchas to know
Before you trust any product-page report, know what your theme + plugin stack does to the data.
- Quick-view modals don’t fire a PDP pageview. If your category page has a “Quick View” hover button (common on Flatsome, Botiga, themes with a “shop” template), clicking it pops up a modal — the visitor never navigates to
/product/X/. Statnive doesn’t see the interaction. Your views count is the count of people who clicked through to a full product page. - Block-based product templates track identically to classic templates. WooCommerce Blocks (Single Product Block, Product Collection Block) fire the same
wc-blocks_viewed_productevent hook. Some themes emit it; most don’t. Statnive’s tracker uses standardpageviewregardless, so block vs. classic doesn’t change the numbers — but if you’re comparing to GA4’sview_itemevents, GA4 sees block-template views only via the WC Google Analytics integration. - “Buy Now” buttons that skip the cart inflate PDP-to-purchase math. If your theme adds a “Buy Now” button that goes directly to
/checkout/, the cart is skipped. Visitors who use it never trigger a/cart/pageview. From an analytics standpoint this is great for conversion; from a CRO analysis standpoint, you cannot distinguish their “no friction” path from a visitor who genuinely had no friction.
The simple weekly PDP workflow
Ten minutes. Once a week. No GA4. No Hotjar.
- Monday morning: open Statnive → Pages → search
/product/→ sort by Views. - Pick the top 5 PDPs.
- Open WooCommerce → Analytics → Products → same date range. Note items-sold per product.
- Compute conversion rate per PDP. Identify the Attractive Failure (high views + low conversion).
- Open the actual PDP. Walk through it on a mobile device. Score against Baymard’s 13-item PDP checklist.
- Pick the single highest-evidence Baymard fix that you can ship in an hour.
- Ship it. Note the date. Come back in 30 days. Measure absolute orders before vs after.
One product, one fix, one month. That is the entire workflow.
For the deeper CRO operating system this fits into, see the pillar on Privacy-First Analytics for WooCommerce CRO. For the channel-quality decision that feeds the PDP traffic in the first place, see Find Best WooCommerce Traffic Sources Without GA4. For the exit-page absolute-loss math that prioritizes what to fix across your whole store, see How to Use Entry and Exit Pages to Improve WooCommerce Sales.