High traffic, zero revenue? It's not volume — it's search-intent fit
Why high traffic without sales is almost always a search-intent mismatch, not a volume problem. Diagnose it with the v1.0.0 Revenue Report's channel × revenue breakdown — free, no GA4 e-commerce setup.
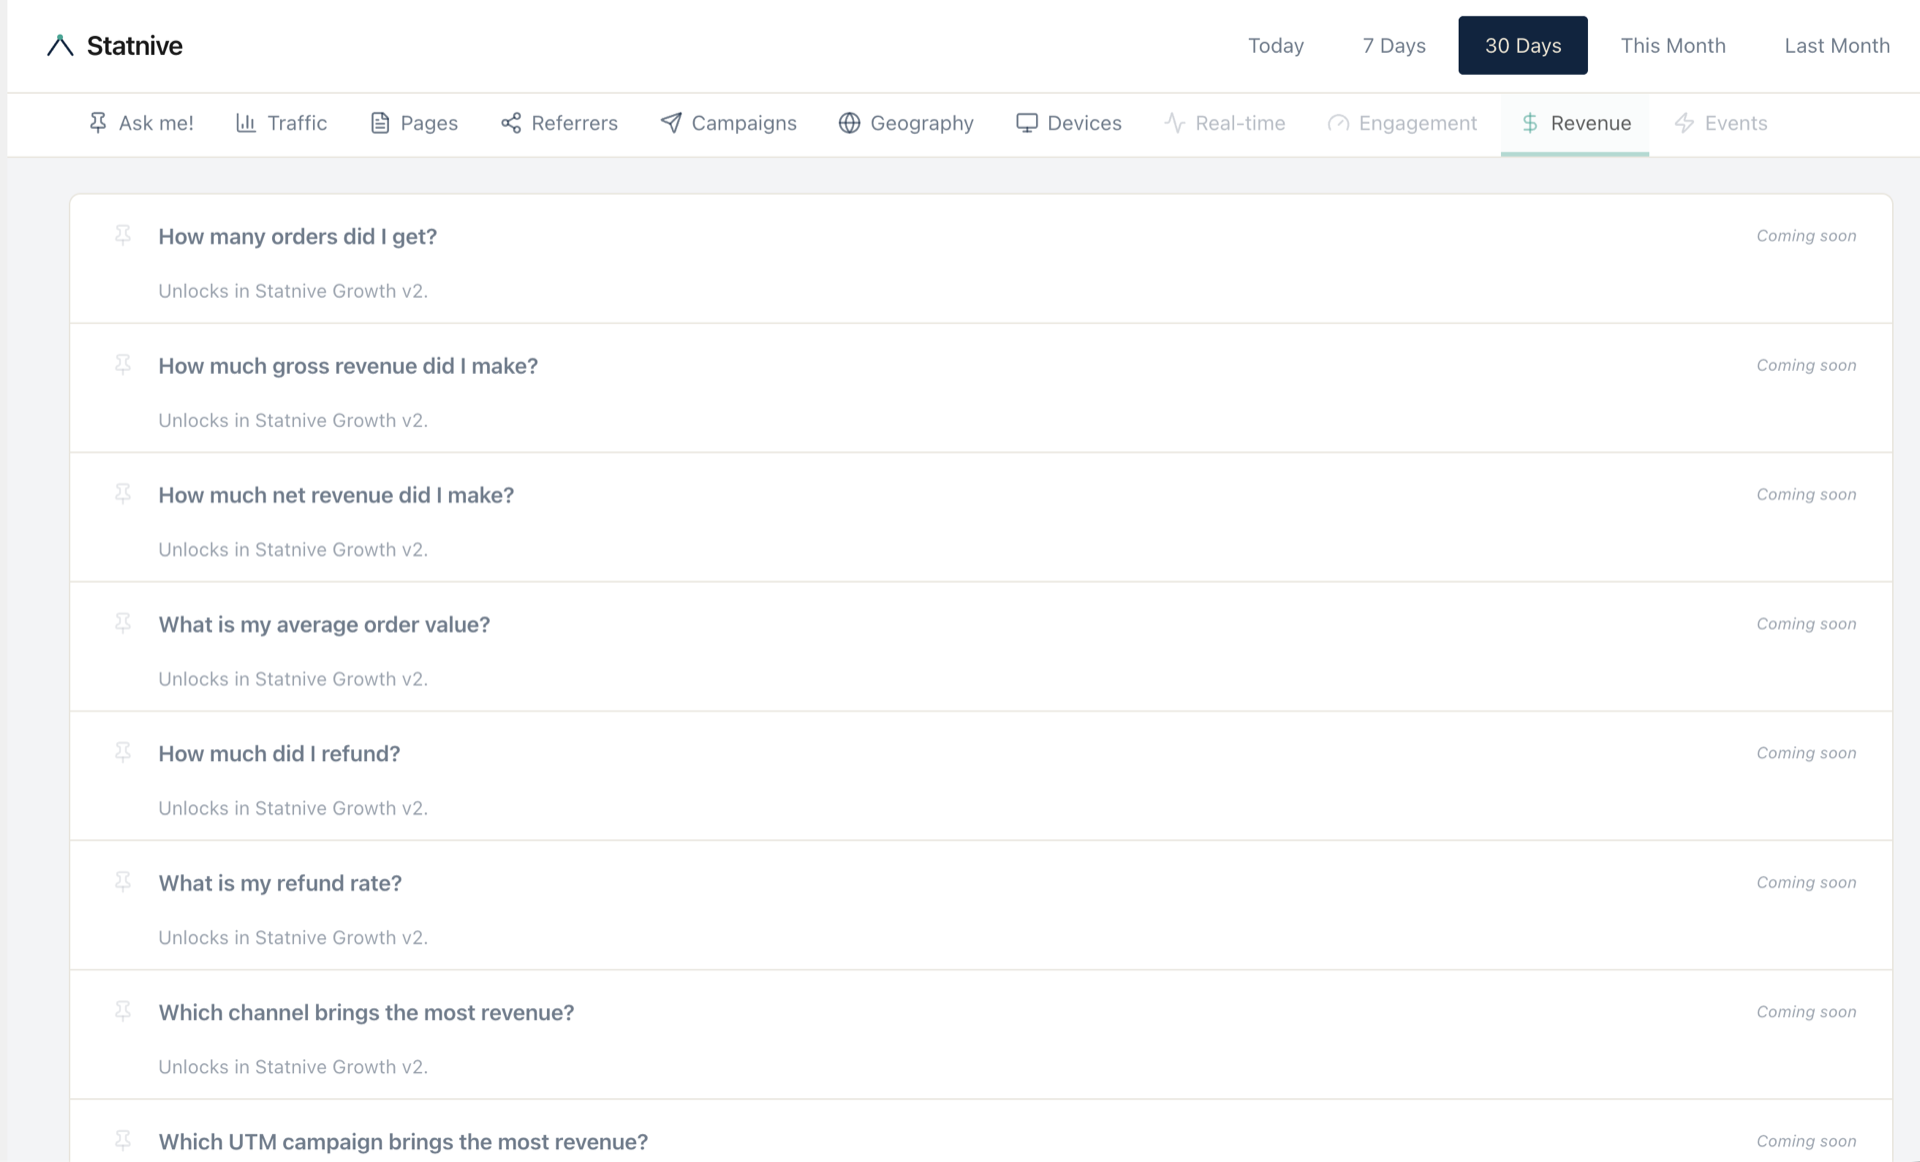
High traffic + zero sales is almost always search-intent mismatch, not volume. Statnive’s Revenue Report (free, v1.0.0) breaks revenue by channel — which sources actually buy. Ask me!‘s revenue cards (「Which channel brings the most revenue?」 q107 and friends) land on the Growth plan; the Revenue Report itself ships today.
“I’m getting what I feel like is a lot of traffic but no sales.” — Shopify Community thread, 2025.
That sentence, in some form, is the most common message in WooCommerce support forums. The owner does not need another acquisition channel. They need to know which of the channels they already have sends buyers — and which sends visitors who were never going to buy in the first place.
This is the closing post of the Ask me! v1.1.0 series, and it is the post where we have to be the most honest. The “Which channel brings the most revenue?” answer card in Ask me! is not live in v1.1.0. The screenshot above is the literal proof: eight Coming-soon cards on the Revenue tab, each marked “Unlocks in Statnive Growth v2”. The v1.0.0 Revenue Report that ships today on the free tier is the live answer in the meantime — and it answers more of this question than most owners realise. Let’s walk it.
What this post answers
- Why “high traffic, zero sales” is almost always intent mismatch, not a volume problem.
- How GA4 answers it — and why most WooCommerce owners never finish the setup that makes the answer work.
- What the live, free, v1.0.0 Revenue Report shows today (and what it does not).
- What the Ask me! revenue cards (q101-q115) will add on the Growth plan when they ship.
- A 3-step decision framework you can run this week, no GA4 e-commerce required.
Why traffic-without-sales is almost always intent mismatch, not volume
The first instinct, when sessions are up and orders are flat, is to chase more traffic. That instinct is almost always wrong. Three numbers explain why.
The all-industry e-commerce conversion rate is 1.89% (IRP Commerce, 2025) — 98 out of 100 visitors leave without buying even on the best stores. A 30% traffic jump without a revenue jump is not surprising. It is only a problem when the mix of intent inside that traffic has shifted toward browsing and away from buying.
Cart abandonment globally sits at 70.19% (Baymard Institute, 2025) — and on mobile, 85.65%. Cart friction is real, but it is a downstream symptom. The upstream cause for most stores is the channel sending the visitor in the first place.
The clincher: mobile drives the majority of traffic but desktop drives the majority of revenue. Mobile converts at 1.8% versus desktop’s 3.9% — a 2.17× desktop advantage (Retail Touchpoints, 2025). If your traffic shifted toward mobile this quarter and revenue is flat, the diagnosis is not “the store is broken” — it is “your traffic is mobile and mobile converts less.” The operating model for that gap lives in Mobile conversion problems on WooCommerce.
The framework that makes this readable in one view is Revenue per Visitor by channel. A source sending 10,000 visitors and $50 is worse than a source sending 200 visitors and $500. Total traffic hides it. RPV exposes it.
How GA4 answers it (and what breaks)
In GA4, the click path to “which channel brings the most revenue” is:
Reports → Monetization → Ecommerce purchases → cross-tab against Session default channel group
That is three clicks if everything is configured. It usually is not.
GA4’s e-commerce reports are only populated if you have wired the purchase event with a revenue parameter, plus typically add_to_cart, begin_checkout, and supporting events, through Tag Manager or a GA4 e-commerce plugin — and the revenue parameter has to map to your store’s currency. Per the GA4 e-commerce documentation, you need at minimum view_item, add_to_cart, begin_checkout, and purchase, each with an items array (SKU, name, price, quantity) and a top-level value on purchase. Most solo owners install GA4, see “0 revenue” six months later, and assume the report is broken. It is not broken — the events were never configured.
Even when configured, GA4 only sees the events the cookie banner captured, the ad blocker did not strip, and Safari ITP did not truncate. By the time the visitor reaches purchase after Apple’s Link Tracking Protection stripped click-IDs (Apple WWDC 2023; Knak), a non-trivial share of the attribution chain is gone.
This is the gap Statnive’s v1.0.0 Revenue Report closes server-side. No event configuration. No purchase event to wire. The report reads WooCommerce orders directly through $order->get_*() getters and attributes them to the 8-channel grouping the Referrers report already uses.
The privacy spine — five claims that hold for every byte the Revenue Report touches
The same five claims hold for the Revenue Report as for every Ask me! card:
- No AI. No LLM. Ask me! is 117 hand-written questions and 63 hand-written SQL handlers (
Questions.php,QuestionResolver.php). Zero models, prompts, embeddings or API calls. - No third-party API. The
AdvisorControllerhas zerowp_remote_*calls. The Revenue Report reads from your own WooCommerce tables server-side. No data leaves your box. - Nothing leaves your server. The REST endpoint runs on your WordPress install. No relay, no CDN-cached endpoint, no telemetry beacon.
- You own the data. Statnive does not host, mirror, or back up anything. Uninstall and the data stays in your database until you drop the tables. WordPress Privacy Exporter and Eraser hooks handle DSAR.
- Cookieless. No fingerprinting. No third-party trackers. Daily-rotating SHA-256 salt hashes; IPs hashed → GeoIP’d → discarded.
Ask me! is a question library, not a chatbot. Your data answers the question; your data never travels.
In Statnive today: the v1.0.0 Revenue Report (free)
This is what is live, free, on WordPress.org as of v1.0.0:
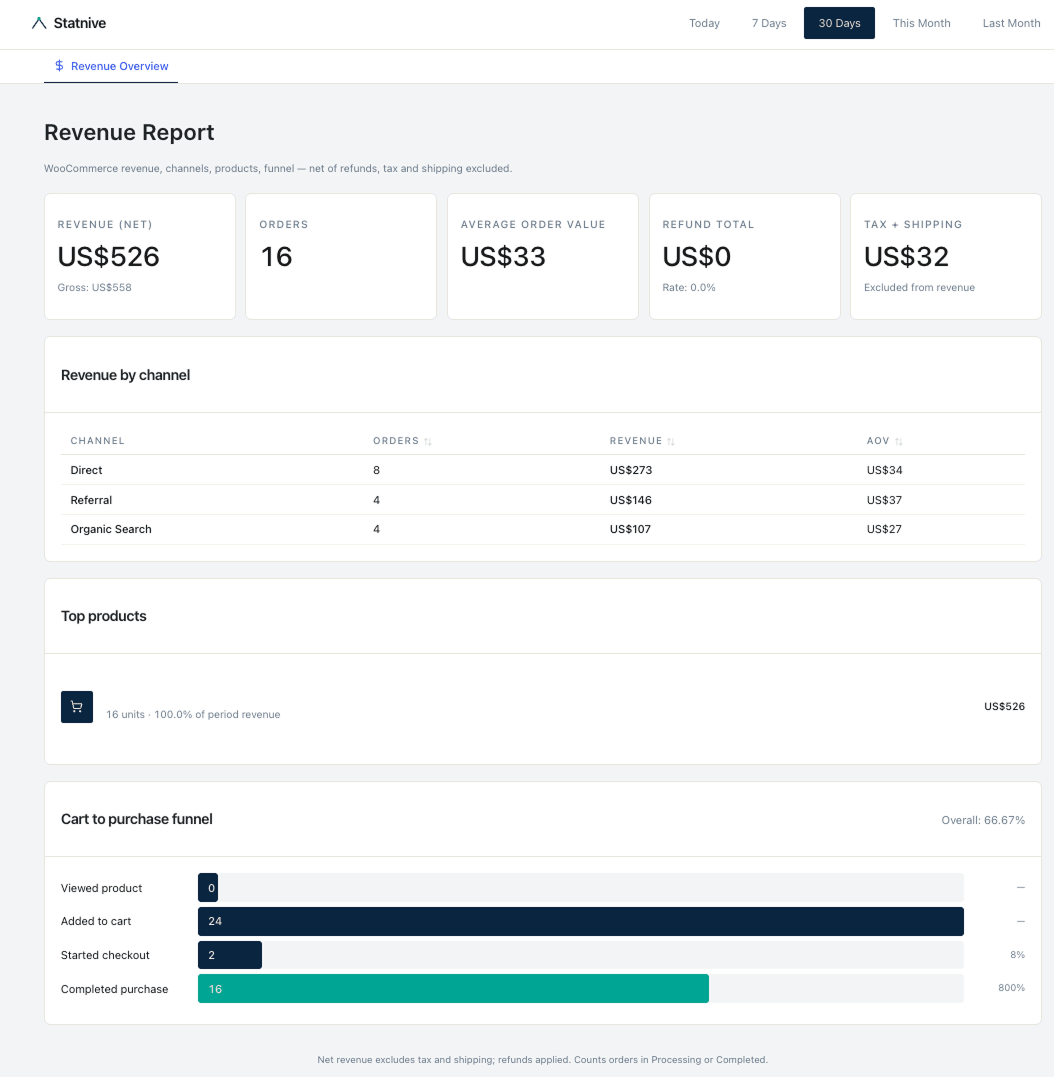
The report ships five KPIs: Orders (count of processing + completed), Revenue net (net_total − refund_total, excluding tax and shipping, with a Gross: $X helper underneath), AOV (net_revenue / orders), Refund total + Rate, and Tax + Shipping (labelled “Excluded from revenue” so the net number stays honest).
And three breakdowns:
- Revenue by Channel. Sortable table — Channel · Orders · Revenue · AOV — across the 8 channels Statnive groups all traffic into (Direct, AI Assistants, Organic Search, Social Media, Email, Referral, Paid Search, Paid Social). This is the row that answers the post’s question.
- Top Products. Top 10 by units or revenue, with variations rolled up under their parent and refunds applied at the line-item level.
- Cart-to-Purchase Funnel. Four server-side stages — Viewed product → Added to cart → Started checkout → Completed purchase — with per-step and overall conversion rates.
In Statnive: open Reports → Revenue Report → see channel × revenue × AOV. No GA4 setup. No
purchaseevent configuration. No third-party API. Channel grouping is automatic. Historical orders backfill in the background on first open.
If “high traffic, zero revenue” is your story right now, that Revenue by Channel table is the one tab to open. Sort by AOV to find the highest-RPV channels; sort by Orders to confirm volume. The mismatch between sessions in your Referrers report (covered in Where is my traffic coming from?) and orders in your Revenue Report is the intent-fit gap, made visible.
What’s coming in Ask me! revenue cards (Growth v2)
The Ask me! Revenue tab — the screenshot at the top of this post — renders 8 Coming-soon cards today. The 15 revenue questions in total carry the same “Unlocks in Statnive Growth v2” marker, including q101 “How many orders did I get?”, q102 “How much gross revenue did I make?”, q104 “What is my average order value?”, q107 “Which channel brings the most revenue?”, and q108 “Which UTM campaign brings the most revenue?”.
These cards are the question-driven version of the breakdowns already in the v1.0.0 Revenue Report — not new SQL paths. q107 pulls the channel × revenue answer forward into the Ask me! pinning and search flow. q108 surfaces UTM × revenue. q104 is AOV as a single card you can pin next to q41 traffic-by-channel.
Why paid? The operational layer that ships with Growth — anomaly alerts on revenue and traffic deltas, Slack and Telegram revenue notifications, ad-spend CSV import with MER, a weekly AI executive summary, Meta CAPI server-side — is what justifies a paid tier. The revenue answer cards sit alongside those layers because that is the workflow they fit into. The Revenue Report itself stays on the free tier, forever. There is no version of this where the data you already had moves behind a paywall.
The 3-step decision framework you can run this week
You can run this whole loop on the free tier, no GA4, no Growth plan, no Ask me! revenue cards required. Open the WordPress admin on Monday morning and do the following.
Step 1 — Find which channels actually buy
Open Reports → Revenue Report. Sort the Revenue by Channel table by Revenue descending. Note the top 3 channels by revenue. Now sort by AOV descending. The channels that appear in both top-3 lists are your high-RPV channels — the ones to protect and scale.
Now flip to the Referrers report. Sort by Sessions descending. Compare the top-3 sessions list against the top-3 revenue list. Any channel that appears in your top-3 sessions list but not in your top-3 revenue list is your intent-mismatch channel. That is the channel sending traffic that does not buy.
The decision rule: if your traffic is up 30%+ week-over-week and revenue is flat, the issue is search-intent fit — not volume. Audit which channels send buyers vs browsers using the Revenue Report channel breakdown. You do not need GA4 funnels for this.
Step 2 — Pair the channel-mismatch signal with the campaign-level question
Open Ask me! and click 「Did my campaign drive traffic?」 (q57). Cross-reference that answer against the same channel rows in the Revenue Report. A paid campaign showing high traffic in q57 but its source channel showing low revenue in the Revenue Report is an under-converting paid source — the kind that quietly drains budget for weeks before anyone notices.
In Statnive: open Ask me! → click 「Did my campaign drive traffic?」 → cross-reference against Revenue Report → done.
This is the loop that catches the most expensive solo-store mistake: continuing to spend on a campaign that sends sessions and never sends sales. The campaign-tab visibility lives in Ask me! today (q57 is Live in v1.1.0); the revenue side lives in the Revenue Report today. Both are free.
Step 3 — Tighten the UTM discipline so step 1 + step 2 keep getting cleaner
This is the boring step that compounds. Bad UTM hygiene is what makes Direct your largest channel — and Direct is the channel where you cannot tell intent. Every paid, email, newsletter, and partnership link should carry a UTM tag.
The five-rule discipline lives in UTM campaigns: stop wasting ad spend on WooCommerce. Short version: lowercase everything, never tag internal links, use medium consistently (email, cpc, social, affiliate), tag every campaign before it ships, and remember that iOS 17 preserves utm_* while stripping fbclid, gclid, mkt_tok — so utm_* is the only attribution channel you can rely on on Apple devices in 2026.
With step 3 in place, steps 1 and 2 get easier every week. The Revenue by Channel report becomes cleaner; Direct share shrinks; paid sources actually attribute.
”Why do I have traffic but no sales?” (PAA)
Almost always intent mismatch. The traffic source — informational organic searches, social scrolling, AI tools sending readers, ad campaigns targeting audiences with the wrong intent — is bringing visitors who were not going to buy. The diagnosis comes from comparing which channels show sessions (Referrers report) against which channels show revenue (v1.0.0 Revenue Report). The mismatch is the answer.
”What traffic metric actually matters for revenue?” (PAA)
Revenue per Visitor (RPV) by channel. Not sessions, not pageviews, not bounce rate, not time on site. RPV exposes the asymmetry: a channel sending 10,000 sessions and $50 has an RPV of $0.005; one sending 200 sessions and $500 has an RPV of $2.50 — 500× more valuable per visitor. Sort the Revenue Report by AOV (the closest current proxy) and the high-value sources surface immediately.
”How do I improve conversion rate from traffic?” (PAA)
In this order: (1) find the highest-RPV channel from the Revenue Report; (2) audit the landing pages those visitors arrive on (use Entry and exit pages for WooCommerce sales); (3) tighten UTM discipline so the channel data stays clean; (4) then optimise checkout friction. Most solo owners reverse this order — they optimise checkout first while the upstream intent gap stays invisible.
The honest reckoning
The screenshot at the top of this post is the literal proof of an honest disclosure. The Ask me! revenue answer cards — q101 through q115 — are Coming soon today; they render the “Unlocks in Statnive Growth v2” marker. The question-driven, one-click, pin-it-to-your-home-tab version of “Which channel brings the most revenue?” is not what shipped in v1.1.0.
What shipped in v1.1.0 is the Ask me! framework around the rest of the catalog — 63 Live answer cards across traffic overview, pages, referrers, campaigns, geography, and devices. What shipped in v1.0.0, four weeks earlier, is the WooCommerce Revenue Report itself: every breakdown the eventual q107 / q108 / q104 cards will surface, available today in its full table form, free.
We could have written this post pretending the Ask me! revenue cards were live and hoped nobody opened the Revenue tab. We did the opposite. The screenshot is the proof; the post is the explanation.
What to do next
- Open the v1.0.0 Revenue Report (Reports → Revenue Report). Sort Revenue by Channel by Revenue, then by AOV. Note which channels appear in both top-3 lists — those are your high-RPV sources.
- Cross-reference your top-sessions channels from the Referrers report against your top-revenue channels. Any channel high on sessions and low on revenue is your intent-mismatch channel.
- Open Ask me! → 「Did my campaign drive traffic?」 (q57) to layer in campaign-level visibility for paid sources. The campaign tab is Live in v1.1.0 today.
- Audit your UTM hygiene using the five-rule discipline in UTM campaigns: stop wasting ad spend. Clean UTM is what keeps your Direct share small and your channel data honest.
- Run the 10-minute weekly review — the operating ritual in The 10-minute weekly WooCommerce analytics review — so the intent-fit signal compounds week over week. The full operating model lives in The Solo WooCommerce CRO Playbook.
Closing
If you run WooCommerce and the traffic-but-no-sales paradox is your reality this week: the Revenue Report is free, the Ask me! supporting cards (q57 campaigns, q41 channels, q9 traffic trend, q81 mobile vs desktop) are Live in v1.1.0 today, the revenue-tab Ask me! cards are honestly Coming soon, and the operating model in The Solo WooCommerce CRO Playbook maps the rest. The intent-fit problem is diagnosable from the data you already have. You do not need GA4 to see it.
That closes the Ask me! v1.1.0 series — ten posts, one pillar, nine question-driven follow-ups. The whole thing is on WordPress.org now.
Install Statnive 1.1.0 from WordPress.org →
Free forever · Self-hosted · No account · 2-minute setup · No AI · No third-party API · Your data never travels