Is your traffic really down? Real trends vs. algorithm noise
Why did my website traffic drop in 2026? AI Overviews stole 34–46% of informational clicks. Open Ask me! → 「Is my traffic up or down?」 (q6) and 「Has my traffic dropped sharply?」 (q10) to separate algorithm noise from a real technical drop.
Traffic dropped 34–46% on informational queries in 2026 — that’s AI Overviews stealing the click (Seer Interactive, Sept 2025), not your content failing. Open Ask me! → 「Is my traffic up or down compared to last week?」 (q6) and 「Has my traffic dropped sharply?」 (q10) to separate algorithm noise from technical drops.
You log in on a Monday morning. The number is lower than last week. Lower than the week before. By Wednesday you’re refreshing GA4 every few hours looking for the cause. By Friday you’re rewriting a year of posts in your head.
A WordPress.org forum thread from 2024 captures the panic exactly: “Traffic dropped to 1-2 visitors by July 23, 2024”. The owner had done nothing wrong. The site had not changed. Google had — and that’s the most common cause of a 2026 traffic drop too.
This post walks the six Ask me! trend questions (q6 / q7 / q8 / q9 / q10 / q11), shows the GA4 click-path you’d otherwise be doing every morning, and ends with a decision rule for separating an AI Overviews loss from a technical regression. The rule fits on a sticky note.
What this post answers
- How to tell an algorithm-driven drop from a technical one in under three clicks.
- Why “traffic down 30% MoM” doesn’t mean what GA4 makes it look like.
- The 2026 baseline: AI Overviews on 47–64% of queries, CTR loss 34–46% on informational, 20–64% on positions 1–3.
- How Statnive’s q10 / q11 anomaly cards ship a Yes/No verdict so you don’t have to interpret a chart.
- The new line chart viz in v1.1.0 for q9 — and what to look at in it.
Why this is the worst question to answer in GA4
The trend-versus-comparison question is exactly the wrong shape for GA4’s default UI. GA4 is event-stream-first; “is this number bigger or smaller than the same number a week ago?” is a report-snapshot shape that requires manual toggle.
Here’s what GA4 makes you do for q6 (“Is my traffic up or down compared to last week?”):
- Open analytics.google.com → pick your property.
- Reports → Reports snapshot.
- Click the date-range picker → switch to “Custom”.
- Set “Last 7 days” → enable “Compare” → set “Previous 7 days”.
- Scroll the Users and Sessions cards on the snapshot; mentally compute the delta. (GA4 shows a green/red arrow but the percentage is colour-coded directionally, not anomaly-flagged.)
Five steps. None of them tell you whether the delta is noise or signal — you have to know that yourself. And to get to q10 (“Has my traffic dropped sharply on the latest day?”) you need a rolling baseline, which GA4 doesn’t compute natively — you’d build it in Explorations with a custom metric and a date-shift formula. That’s a 20-minute build for a question you wanted answered in two seconds.
The thing GA4 actually does well — trend lines over arbitrary ranges — is buried behind a custom Exploration. The thing you want most mornings — is today abnormal? — isn’t there at all.
The privacy contract — five claims that hold for every Ask me! query
Before the Statnive callout, the spine of why this works: every Ask me! answer runs against your own MySQL database on your own server, through the same SQL the dashboard already runs. There is no AI model, no LLM, no embedding, no prompt, no Claude/ChatGPT/Gemini API call. The AdvisorController makes zero outbound HTTP calls — no wp_remote_get, no wp_remote_post. Your data never leaves your server; Statnive doesn’t host, mirror, or back it up anywhere. Tracking itself is cookieless: daily-rotating SHA-256 salt hashes mean the same visitor is a different hash tomorrow, and IPs are hashed → GeoIP’d → discarded. Ask me! is a question library, not a chatbot. Your data answers the question; your data never travels.
In Statnive: three questions, three clicks
Open the Statnive admin → Ask me! tab. Type “drop” or “trend” in the search bar. Six trend cards appear:
- q6 — Is my traffic up or down compared to last week? Delta card with a Yes/No-flavoured verdict and the comparison number.
- q7 — Which day had the most traffic? Peak-day callout. Useful for content scheduling.
- q8 — Which date had the lowest traffic? Trough-day callout. Useful for crisis archaeology.
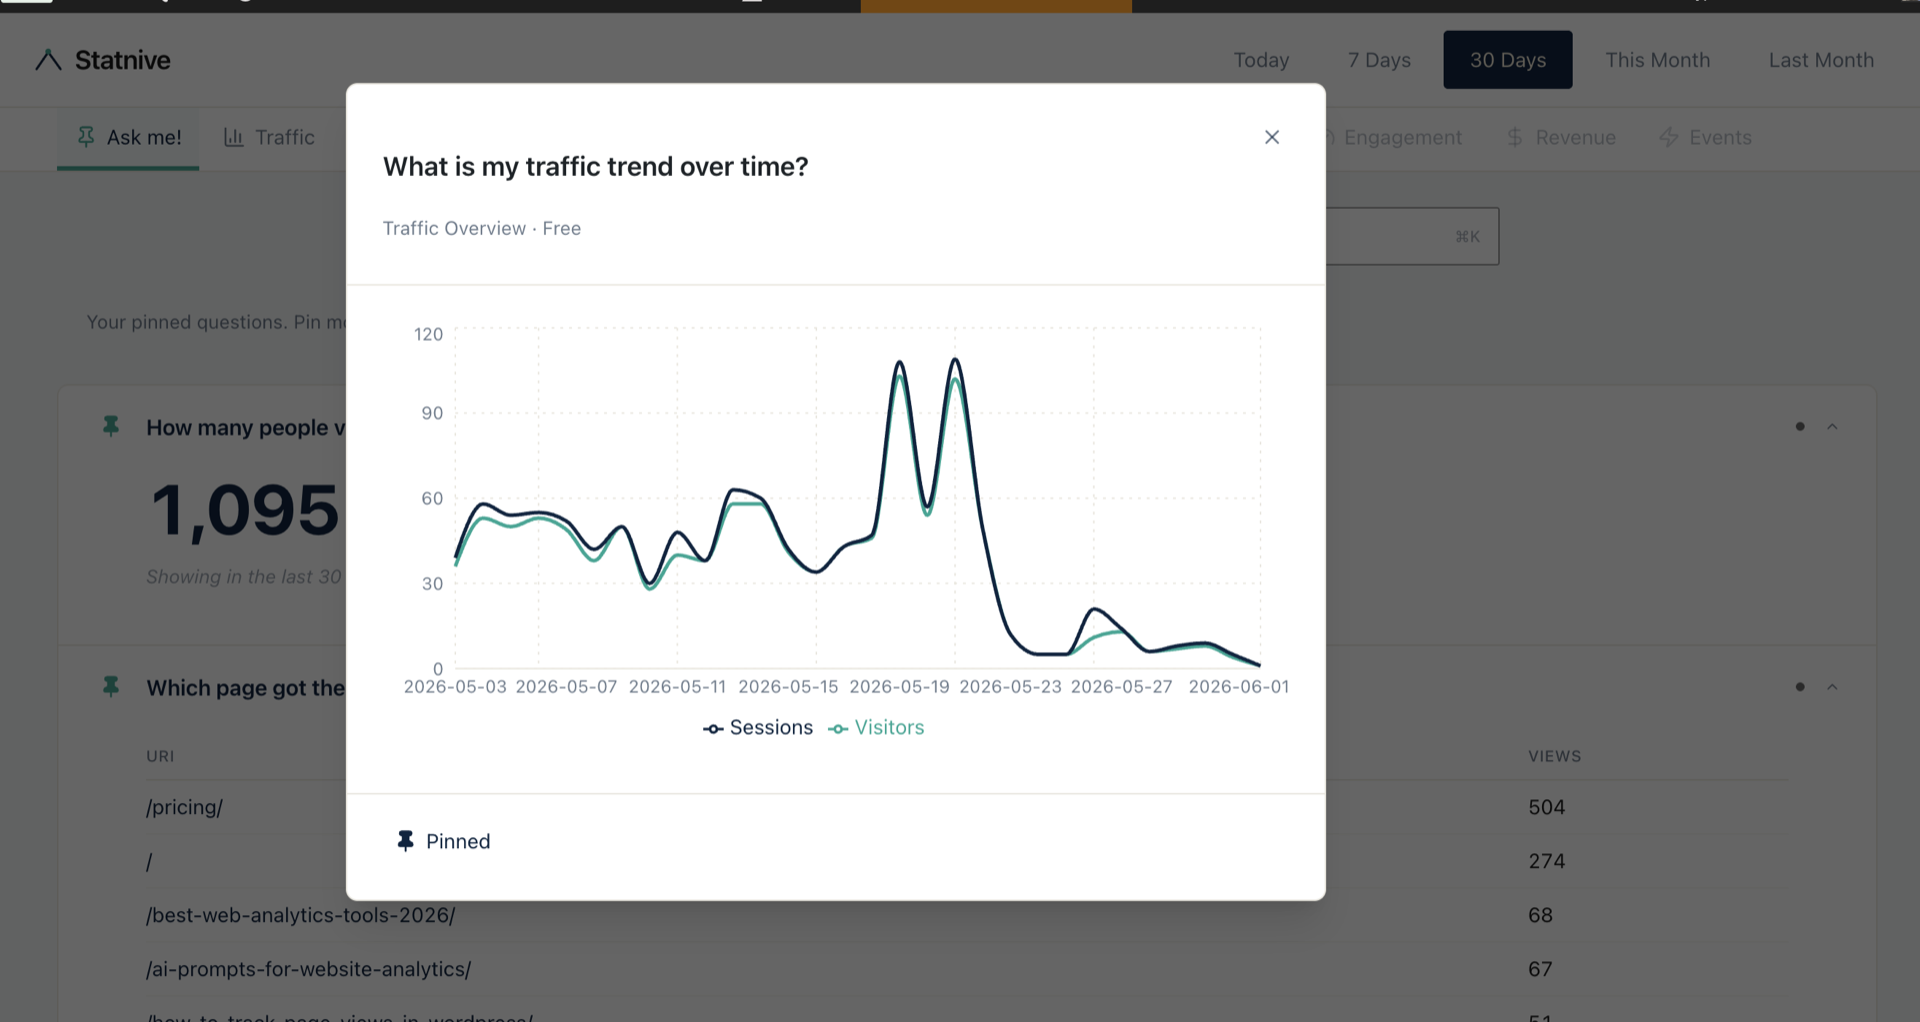
- q9 — What is my traffic trend over time? Line chart, 30 days, Sessions + Visitors series. New v1.1.0 viz.
- q10 — Has my traffic dropped sharply on the latest day? Anomaly card with a Yes/No chip and the rolling-baseline number.
- q11 — Has my traffic spiked sharply on the latest day? Same shape, opposite direction.
In Statnive: open Ask me! → click 「Is my traffic up or down compared to last week?」 → done.
The hero screenshot above is the q9 AnswerModal in v1.1.0. It’s a new line-chart viz that shipped with Ask me! — two series (Sessions and Visitors) over 30 days, drawn from the same trend SQL the dashboard’s Traffic Overview tab uses. The shape of the line is the answer; you don’t need to scroll.
The killer card in the set is q10. Most owners aren’t asking “what does my trend look like?” — they’re asking “is something wrong?”. q10 ships a Yes/No chip on the delta viz (one of the v1.1.0 viz improvements listed in the 1.1.0 changelog), so the answer is a colour-coded verdict instead of a chart you have to interpret.
For context across categories — what’s behind the trend — pin the Traffic tab and you get the matching channel and source views:
![Statnive Ask me! Traffic Overview tab — 10 question cards including "How many people visited", "What is my traffic trend over time?", "Is my traffic up or down compared [window]?", and the q10/q11 anomaly cards](/screenshots/admin/ask-me/tab-traffic.png)
Decision rule: separate algorithm from technical in three checks
When q10 fires Yes, run this three-check diagnostic in order. Each step is one Ask me! card or one URL:
- Is the drop concentrated in organic search? Open the Channels view (or pin q41 “Where is my traffic coming from?”). If organic is down 40% and direct / email / referral are flat or up, it’s algorithmic — likely a Google update or AI Overviews expansion. If every channel is down at once, skip to step 3.
- Are AI Overviews showing on your old top queries? Manually spot-check 5–10 of your top-traffic queries in an incognito Google search. If AI Overviews appear on most of them, you’ve found the cause. The 2026 baseline: AI Overviews appear on 47–64% of queries (Seer Interactive, Sept 2025), and they reduce CTR on positions 1–3 by 20–64%. The hit is real and it isn’t your fault.
- Is the drop also visible in Search Console impressions? If impressions are flat but clicks are down, AI Overviews are the cause (you’re still ranking; users aren’t clicking through). If impressions are also down, it’s an algorithmic re-ranking or a technical issue — check
robots.txt, sitemaps, server response time, and recent plugin updates in that order.
The decision rule, one sentence: organic-only drop + AI Overviews on your top queries + flat or rising impressions = AI Overviews ate the click; don’t rewrite anything. Cross-channel drop or impression-collapse = technical, check it now.
What caused the March 2026 traffic drop?
The March 2026 Google core update is widely cited as the “small sites are dying” moment of the year, but the data doesn’t actually say that — what it says is that informational SERPs are getting eaten by AI Overviews on top of the regular core-update churn. The numbers worth knowing:
- AI Overview prevalence: 4.5% of queries (Dec 2024) → 13.14% (Mar 2025) → 47–64% of queries in 2026 (Seer Interactive, Sept 2025). The trend line is steepening, not flattening.
- CTR loss on informational queries: 34–46% (Search Engine Land summary of Pew data, Sept 2025). Branded queries actually saw +18% in the same study, which tells you what to invest in.
- Position 1–3 CTR loss when an AI Overview appears: 20–64% (Seer Interactive). The higher you were ranking, the more you lose in absolute clicks — which feels personal, but isn’t.
If your drop matches the timing of a core update (mid-March 2026, late-April 2026) and is concentrated in organic informational queries, the cause is structural to the SERP, not specific to your site. The work isn’t to rewrite your posts — it’s to invest in the parts of the SERP that AI Overviews haven’t eaten: branded queries, video, community discussion, and direct-traffic channels (newsletters, social referrals, AI assistants).
How much does AI Overview affect small sites?
Small sites get hit hardest for two structural reasons.
The first is brand search. AI Overviews on branded queries actually increase CTR by 18% on average — the searcher already knows your name, the Overview confirms you, they click. Sites with a recognisable brand absorb most of the AI-Overview impact and lose informational clicks but keep brand clicks. Sites without a brand presence — which is most small WordPress sites with a few thousand monthly visits — have nearly all of their traffic on informational queries and lose 34–46% of clicks across the board.
The second is search intent diversity. Larger sites have a portfolio across informational, navigational, transactional, and commercial-investigation queries. Small sites usually have one or two intent types, often heavily informational. AI Overviews skew toward informational SERPs — which means the entire traffic base is in the strike zone.
The honest framing for a small site in 2026: expect 20–40% of your organic traffic to evaporate if your content stayed put while the SERP changed underneath it. This is not a quality penalty; it’s a click-distribution shift. Your content still answers the question. Google is now also answering it directly, in the same SERP.
Should I worry about core updates?
Core updates are diagnostic, not punitive. Here’s how to think about them:
- A core update that hits one channel only (organic search) is structural, not personal. Google re-ranks; you ride the wave. Don’t rewrite.
- A core update that hits every channel is not a core update. Direct, social, email, and referral don’t move with Google’s algorithm. If they all dropped at once, you have a technical issue (broken sitemap, bad redirect, plugin conflict, server outage that ate your tracker beacons).
- A core update that hits revenue but not visits is an intent problem. People are arriving but not buying — see the upcoming Post 10 on the Revenue Report.
Statnive’s q10 anomaly card uses a rolling baseline rather than a flat YoY comparison, so it doesn’t flag every Christmas-week dip or weekend valley as a drop. It fires when today is statistically below your recent normal — which is the signal you actually want.
What to do next
- Pin q6, q9, and q10 to your Ask me! home. You’ll check these three every morning. Three Yes/No verdicts, ten seconds of work.
- Cross-reference with the channel view. When q10 fires Yes, open Where’s your traffic actually coming from? and check whether organic is the only channel down. If yes, it’s algorithmic.
- Audit AI Overview prevalence on your top queries. Pick the 10 queries that drove the most traffic last quarter (from Search Console). Spot-check in incognito. If AI Overviews are showing on most of them, that’s the click that the SERP no longer sends — pair this with Ask me! q53 「Did AI tools send me traffic?」 to see how much of that demand is showing up in the AI Assistants channel instead.
- Don’t rewrite during an algorithm hit. Wait 4–6 weeks. Use that time to find the queries that didn’t lose anything — those are your bench, and your next content investment should look like them.
- Read Find your real top pages to identify your bench. Pages still pulling traffic 90+ days after publish are the ones AI Overviews aren’t eating yet. Build more of those.
If you’re new to Statnive, the whole loop above takes one click each in Ask me! There’s no GA4 Exploration to build, no Search Console comparison range to set up, no cookie banner to mediate.
Install Statnive 1.1.0 free from WordPress.org →
Free forever · Self-hosted · No account · 2-minute setup · No AI · No third-party API · Your data never leaves your server.