Mobile dominates traffic, desktop still pays: the 2026 breakdown
Mobile drives 64% of traffic but desktop converts 2.17× better. The honest mobile vs desktop 2026 breakdown for WordPress owners — with the one-click Statnive Ask me! card and no GA4.
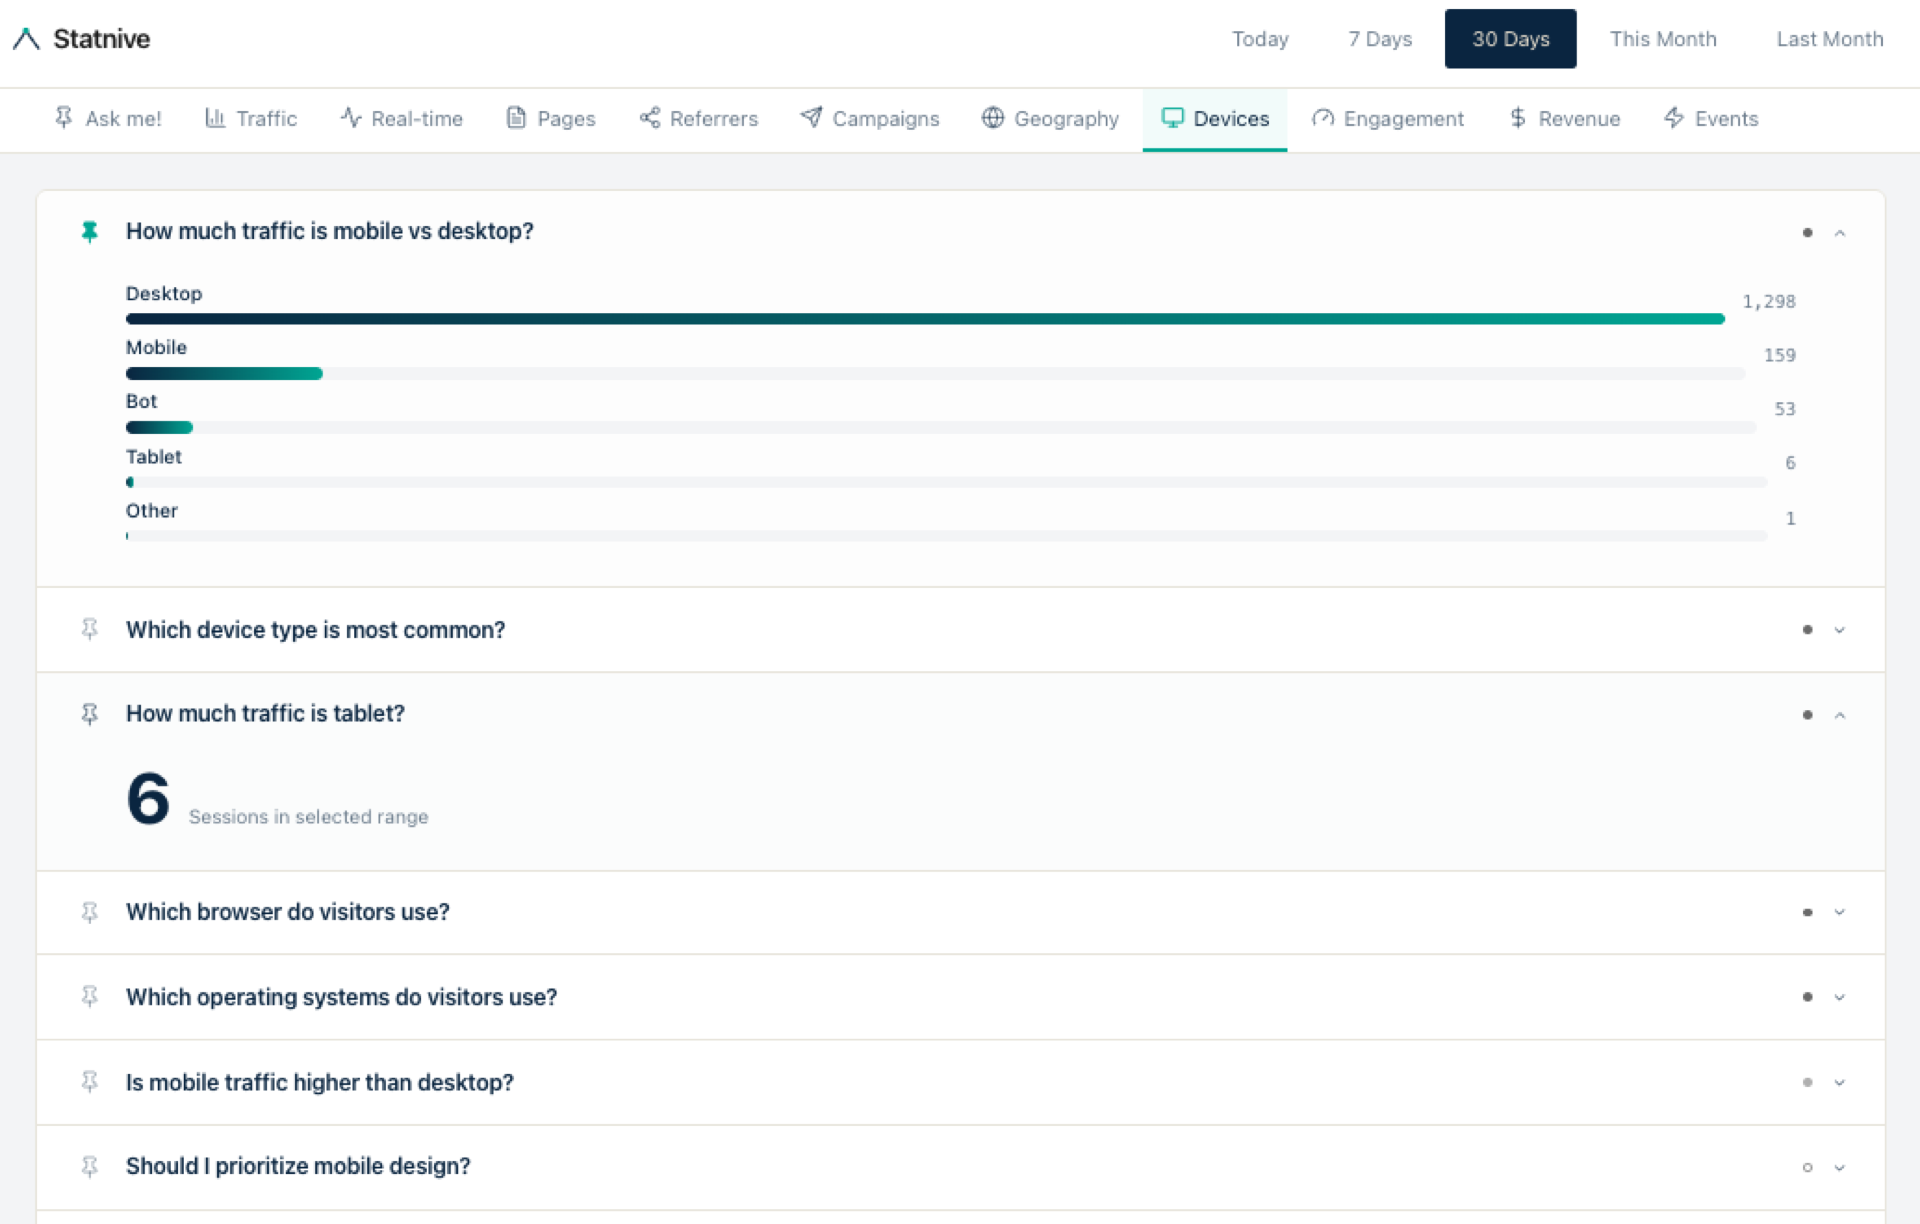
Mobile drives 64.35% of global traffic (StatCounter, July 2025) but desktop converts 2.17× better (3.9% vs 1.8%, Retail Touchpoints 2025). Open Ask me! → 「How much traffic is mobile vs desktop?」 (q81) to see your split in one card — your gap likely explains your revenue mix.
Every WooCommerce owner has had this Sunday-night conversation with themselves: “Mobile is everything. So why do most of my orders still come from desktop?” Then the spiral starts. Is the mobile checkout broken? Is the cart button below the fold? Is Apple Pay misfiring? Are mobile shoppers just browsers who buy later from their laptop?
The answer is mostly the last one — and it has been for three years. But the only way to act on it is to see your own mobile vs desktop split, mapped against bounce and conversion, in one view. GA4 makes you cross-tab three reports to get there. Ask me! shows it as a single card.
What this post answers
- The 2026 baseline split for mobile, desktop, and tablet — global and regional.
- Why mobile dominates traffic and why desktop still dominates revenue.
- The honest mobile cart abandonment number (it is not the global 70.19% you keep seeing).
- How GA4 makes you build the device cross-tab, and how Ask me! collapses it.
- The decision rule: when a device gap is real and worth fixing, versus when it is just normal mobile behaviour.
The 2026 device baseline (the only numbers to anchor against)
Stop trusting whatever device split your designer remembered from a 2018 blog post. The 2026 numbers are:
| Metric | Mobile | Desktop | Tablet | Source |
|---|---|---|---|---|
| Share of global web traffic | 64.35% | 33.31% | 2.34% | StatCounter GlobalStats, July 2025 |
| Share by region — Africa | 79.12% | 19.84% | 1.04% | StatCounter (same) |
| Share by region — Asia | 72.3% | 25.96% | 1.74% | StatCounter (same) |
| Share by region — North America | 56.75% | 39.95% | 3.3% | StatCounter (same) |
| Share by region — Europe | 50.64% | 46.71% | 2.65% | StatCounter (same) |
| E-commerce conversion rate | 1.8% | 3.9% | (mid) | Retail Touchpoints, 2025 |
| Cart abandonment rate | 85.65% | 69.75% | 80.74% | Baymard Institute, 2025 update |
Three things to lock in from this table.
First, the global 64% mobile number is not your number. If you sell to North America or Europe, your mobile share probably sits closer to 50–57%, because StatCounter’s global average is pulled up by smartphone-first regions where desktop barely exists. Treat the global figure as a sanity ceiling; trust your own data for the working number.
Second, desktop’s 2.17× conversion advantage is structural, not a glitch. Bigger screens reduce form-field friction. Saved payment credentials sit on the work laptop. Buyer-mode focus is higher when both hands are free. None of those are mobile-design failures — they are device affordances.
Third, the 70.19% global cart abandonment number that gets quoted everywhere is the blended average. The honest version by device — mobile 85.65%, desktop 69.75%, tablet 80.74% — is what you compare your own funnels against. A 75% mobile cart abandonment is better than average; a 60% desktop cart abandonment is better than average. The blended number lets you congratulate yourself on the wrong thing.
Why mobile wins the visit and desktop wins the buy
The split is not random. Mobile skews toward discovery browsing (casual social-driven scrolling), research-mode reads (reviews, comparisons, blog articles — decision deferred), quick check-ins (order status, support pages), and impulse buys at low ticket size ($5–$40, one-tap Apple Pay). Desktop skews toward the opposite: deliberate purchases with multi-tab comparison, B2B and pro-buyer flows with invoice billing, return visits with saved credentials (the laptop remembers the card), and long-form configuration (personalization, complex variations).
Per Baymard’s 2025 device breakdown, mobile shoppers abandon at 85.65% — about 16 percentage points worse than desktop — and most of that gap is behavioural, not UX failure. They were browsing, not buying. This is the frame that turns the device cross-tab from a panic chart (“why is my mobile so bad?”) into a planning chart (“how do I move more mobile browses into desktop returns?”).
How GA4 answers it
GA4 has the data. It just makes you assemble it: Reports → Tech → Tech details → pick “Device category” → cross-tab against Sessions, then against Engagement rate, then re-pull with Conversions as the secondary metric. Four to five clicks per metric, repeated three times, because none of those views shows volume × bounce × conversion in one place. And in 2026 the picture gets messier still: iOS 18’s Advanced Tracking Protection continues to tighten the screws on mobile attribution — referrer headers stripped in more in-app browsers, more cross-site cookies dropped, more sessions landing in Direct. Your GA4 mobile share will look a little lower than your real mobile share, and your mobile conversion a little worse than reality, because the lost attribution disproportionately hits the smaller-screen audience.
Why Statnive sees mobile honestly (and what it never sees)
Five claims hold for every Ask me! query, including the device cards:
- No AI. No LLM. The 117 questions are hand-written; the answers are hand-written SQL.
- No third-party API. Zero outbound calls from the Ask me! pathway. The
AdvisorControllermakes nowp_remote_*request. - Nothing leaves your server. REST endpoint sits on the same WordPress install; no relay, no proxy, no CDN-cached endpoint.
- You own the data. Statnive does not host, mirror, syndicate, or back up the data anywhere.
- Cookieless. No fingerprinting. No third-party trackers. Daily-rotating SHA-256 salt hashes; IPs hashed, GeoIP’d, and discarded ephemerally.
Device detection works on the User-Agent string at ingest time, server-side, and only the category (mobile / desktop / tablet) is stored. There is no fingerprint, no canvas read, no resolution probe, no localStorage write. The mobile share you see is the mobile share that actually reached your server — not the mobile share that survived the consent banner, not the mobile share that did not get filtered by an ad blocker. Ask me! is a question library, not a chatbot. Your data answers the question; your data never travels.
In Statnive: open Ask me! → click the question → done
In Statnive: open Ask me! → click 「How much traffic is mobile vs desktop?」 → done.
The Devices tab carries five Live questions you can click straight through to today:
- q81 — How much traffic is mobile vs desktop? The headline split, with sessions and share by device.
- q82 — Which device type is most common? The single-line answer (“Mobile, 61% of sessions”) with the delta vs last period.
- q83 — How much traffic is tablet? The forgotten 2–3% — usually iPads, usually evening, often higher AOV.
- q86 — Is mobile traffic higher than desktop? A Yes/No chip on top of the underlying numbers, for the weekly skim.
- q87 — Should I prioritize mobile design? A recommendation card that reads the share and gives the Mobile-first / Balanced / Desktop-first call.
The decision rule
The rule, in one sentence: a mobile vs desktop gap is a problem to fix only when the mobile bounce is more than 15 percentage points above your desktop bounce inside the same intent cohort.
Three caveats:
- Compare cohorts, not site averages. Your blog mobile bounce will be 70–90%; your product-page mobile bounce should be 40–60%. The page type matters more than the device. Compare mobile-PDP to desktop-PDP, mobile-blog to desktop-blog. Never mobile-overall to desktop-overall.
- Require ≥50 sessions per device per cohort. Below that, the bounce is noise. The Statnive Devices tab and the Pages report cross-tab natively; the 50-session floor is the same one used in the channel-quality rule.
- Diagnose before re-designing. A mobile bounce 20pp above desktop usually means the above-the-fold render is too slow (LCP > 2.5s on 4G), or the primary CTA is below the fold on the iPhone SE viewport, or the photo carousel blocks the price. Fix the specific thing before A/B testing the whole template.
If your mobile bounce sits inside the cohort norm and your gap is still 15pp+, you almost certainly have a JavaScript-driven layout shift on first paint or a render-blocking font. Test in Chrome DevTools’ mobile emulation with throttled 4G before redesigning anything.
What about q90 — “Does mobile look worse than desktop?”
The Devices tab carries six question slots. The sixth — q90 “Does mobile look worse than desktop?” — renders a Coming soon card in v1.1.0. The honest disclosure: this card lands in v1.2 / Statnive Growth v2. The answer needs per-device engagement signals (time-on-page, scroll depth, click-through) that depend on a small schema migration adding engagement_time and scroll_depth columns. The migration ships in v1.2 on the free tier for the time-on-page signal; the layered cross-device-quality scoring lands on the Growth v2 plan when it ships. In the meantime, q81 + q86 + q87 give you the share and the priority call.
”Why is mobile traffic so much higher?”
Mobile share crossed 50% globally in 2016 and has not given the lead back. Smartphone-first regions skipped the desktop generation entirely (Africa now sits at 79.12% mobile); social media is structurally mobile-first; and casual browsing migrated into the dead time between other things — the train commute, the queue at the coffee shop, the ten minutes before bed. The right reading isn’t “panic about desktop” — it’s “the phone audience is enormous and behaves differently; design for the difference, don’t try to flatten it."
"How to compare mobile vs desktop analytics?”
Three numbers per device, side by side, every Monday: share of sessions (who is visiting), bounce rate by page type (who is engaging), conversion rate (who is paying). The Statnive Devices tab gives the share; the Pages tab gives the per-page bounce; the WooCommerce Revenue Report (free, v1.0.0) gives the conversion. The thing to not do: compare mobile against desktop on a single combined funnel. Mobile and desktop are two parallel funnels with different physics — treating them as one is how owners end up redesigning the desktop checkout because the mobile drop-off looks bad.
”Does mobile convert better than desktop?”
No, and not for any 2026 store we have seen. Per Retail Touchpoints’ 2025 study, desktop converts at 3.9% versus mobile’s 1.8% — a 2.17× advantage that has been stable since 2022. The two exceptions: pure-impulse categories where the cart is a one-screen action (snacks, $5 digital downloads), and app-driven flows where a strong PWA or native app outperforms desktop. For a typical WooCommerce store on a typical month, plan for desktop to drive the majority of revenue from a minority of sessions, and plan for mobile to drive the majority of first-touches on the customer journey.
What to do next
- Install Statnive on WordPress.org if you haven’t yet.
- Open Ask me! → Devices tab and click q81 to see your real mobile / desktop / tablet split.
- Cross-check the regional baseline. If your store sells to NA + EU, expect mobile to land 50–57%, not 64%. Anything well below that means you’re under-indexing on mobile traffic; anything well above means you’re under-indexing on desktop reach.
- Run the 15-percentage-point bounce test inside one cohort — your top product page is the obvious starting point. Compare mobile-PDP bounce to desktop-PDP bounce in the Pages tab.
- If you sell on WooCommerce, follow the per-device cart abandonment thread to the related guide on mobile conversion problems — it walks through the four mobile-checkout issues we keep seeing on solo Woo stores.
- For revenue mix by channel — which is usually where the mobile-vs-desktop conversation ends up — read sibling Post 2, Where’s your traffic actually coming from?. If most of your mobile traffic is Social and most of your desktop traffic is Organic Search, you have the explanation for the revenue mix without needing another tool.
That’s the loop. One card for the split. One rule for the gap. One Sunday-night conversation you don’t have to have anymore.
Install Statnive 1.1.0 free from WordPress.org →
Free forever · Self-hosted · No account · 2-minute setup · No AI · No third-party API · Your data never leaves your server.